Infant
у
22
20
*
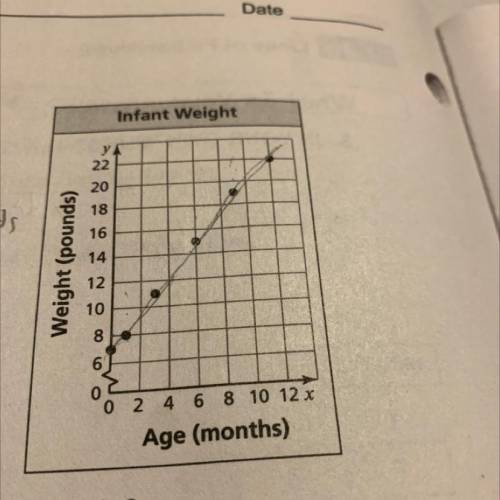
1. The scatter plot shows the weights y of an infant
...

Mathematics, 08.03.2021 07:00 23mwade
Infant
у
22
20
*
1. The scatter plot shows the weights y of an infant
from birth through x months.
a. At what age did the infant weigh 11 pounds?
b. What was the infant's weight at birth?
c. Draw a line that you think best approximates the points
d. Write an equation for your line.
e. Use the equation to predict the weight of the
infant at 18 months.
f. Does the data show a positive, a negative, or no relationship?

Answers: 2


Another question on Mathematics
Mathematics, 21.06.2019 19:00
Atheater wants to build movable steps that they can use to go on and off the stage. they want the steps to have enough space inside so they can also be used to store props. how much space is inside the steps?
Answers: 1
Mathematics, 21.06.2019 19:30
Which inequality has a dashed boundary line when graphed ?
Answers: 2
Mathematics, 21.06.2019 19:30
Aline passes through 3,7 and 6,9 what equation represents the line
Answers: 2
Mathematics, 21.06.2019 20:30
If a 36 inch yardstick casts a 21 foot shadow, how tall is a building whose shadow is 168 feet? what is the scale factor
Answers: 1
You know the right answer?
Questions

Advanced Placement (AP), 12.12.2020 16:50
Mathematics, 12.12.2020 16:50

Chemistry, 12.12.2020 16:50

Chemistry, 12.12.2020 16:50
Mathematics, 12.12.2020 16:50

Mathematics, 12.12.2020 16:50

Health, 12.12.2020 16:50
Mathematics, 12.12.2020 16:50
Chemistry, 12.12.2020 16:50
Chemistry, 12.12.2020 16:50
Chemistry, 12.12.2020 16:50

Spanish, 12.12.2020 16:50


