
Mathematics, 07.03.2021 04:20 culturedxnat
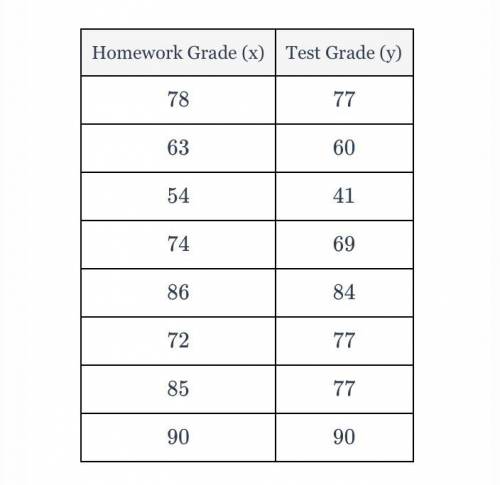
A mathematics teacher wanted to see the correlation between test scores and homework. The homework grade (x) and test grade (y) are given in the accompanying table. Write the linear regression equation that represents this set of data, rounding all coefficients to the nearest tenth. Using this equation, find the projected test grade, to the nearest integer, for a student with a homework grade of 34. I WILL MARK BRAINLIEST. HELP ME

Answers: 3


Another question on Mathematics
Mathematics, 20.06.2019 18:04
For an experiment, a penny is tossed. at the same time, a spinner with 8 congruent sections numbered 1–8 is spun. how many possible outcomes are there for the experiment?
Answers: 1
Mathematics, 21.06.2019 20:30
26) -2(7x) = (-2 • 7) x a. associative property of addition b. associative property of multiplication c. commutative property of multiplication d. commutative property of addition
Answers: 1
Mathematics, 21.06.2019 21:30
Over the course of the school year, you keep track of how much snow falls on a given day and whether it was a snow day. your data indicates that of twenty-one days with less than three inches of snow, five were snow days, while of the eight days with more than three inches of snow, six were snow days. if all you know about a day is that it is snowing, what is the probability that it will be a snow day?
Answers: 1
You know the right answer?
A mathematics teacher wanted to see the correlation between test scores and homework. The homework g...
Questions
Mathematics, 10.03.2021 19:40

Mathematics, 10.03.2021 19:40


Chemistry, 10.03.2021 19:40

Biology, 10.03.2021 19:40
Mathematics, 10.03.2021 19:40
Biology, 10.03.2021 19:40
English, 10.03.2021 19:40
Mathematics, 10.03.2021 19:40

English, 10.03.2021 19:40
Mathematics, 10.03.2021 19:40


