
Mathematics, 06.03.2021 04:00 trevorhenyan51
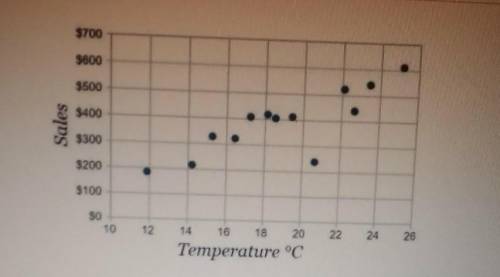
The scatter plot shows the relationship between ice cream sales and temperature at noon on that day at sea side ice cream shop. Which statements are correct?
A) The data shows one potential outlier B) The data shows a linear association C)The data shows a clustering pattern
D) The data shows a negative association E) As temperature increases ice cream sales increase

Answers: 1


Another question on Mathematics
Mathematics, 21.06.2019 13:20
Mr. walker gave his class the function f(x) = (x + 3)(x + 5). four students made a claim about the function. each student’s claim is below. jeremiah: the y-intercept is at (15, 0). lindsay: the x-intercepts are at (–3, 0) and (5, 0). stephen: the vertex is at (–4, –1). alexis: the midpoint between the x-intercepts is at (4, 0). which student’s claim about the function is correct?
Answers: 2
Mathematics, 21.06.2019 13:50
Question and answers are in the attached picture. you so much in advance.
Answers: 3
Mathematics, 21.06.2019 19:30
Kyle and elijah are planning a road trip to california. their car travels 3/4 of a mile per min if they did not stop driving, how many miles could kyle and elijah drive in a whole day? ? 1 day = 24 hours. plzzz i will give you 100 points
Answers: 2
You know the right answer?
The scatter plot shows the relationship between ice cream sales and temperature at noon on that day...
Questions

English, 24.02.2022 07:10

Medicine, 24.02.2022 07:10
Mathematics, 24.02.2022 07:10

Mathematics, 24.02.2022 07:10

Mathematics, 24.02.2022 07:10
Mathematics, 24.02.2022 07:10


English, 24.02.2022 07:10

History, 24.02.2022 07:10


