8

Mathematics, 04.03.2021 21:20 sheazy3709
2020-2021 T-Math-Alg1-T6-CBT: Section
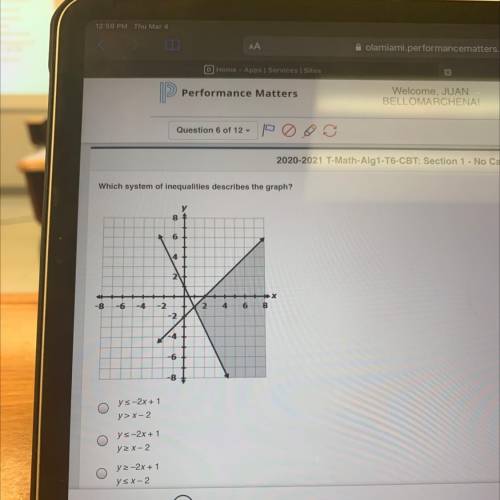
Which system of inequalities describes the graph?
8
6
4
X
-8
-4
2
4
6
8
-2
-2
-4
-6
-8
ys-2x + 1
y>X-2
ys-2x + 1
ya x-2
y2-2x + 1
y sx-2

Answers: 2


Another question on Mathematics
Mathematics, 21.06.2019 21:00
Complete the worksheet. use 3.14 for π and round all decimals to the nearest hundredth.find the volume of the composite three-dimensional figure above. important terms are written in bold.1. the pyramid has a square base that is inscribed in the circular base of the cone. draw an image of the composite shape of the base. 2. if the side length of the square base is 8 units long, what is the diameter of the circular base of the cone from the picture in number 1? 3. now that the diameter has been calculated, what is the circular area of the cone? ignore the square base of the pyramid.? 4. what is the formula for volume of a cone? 5.to calculate the volume of the cone, the height is still needed. if the cone has a lateral surface with a length of 13 units, what is the height of the cone? 6.now find the volume of the cone. do not include the empty space for the pyramid. 7.. the side length of the square base of the pyramid is 8 units long. what is the base area of the pyramid? 8.what is the formula for the volume of a pyramid9. since the cone and the pyramid share the same vertex, what is the volume of the pyramid10.using the volume of the cone and the pyramid, find the volume of the composite shape. remember, the pyramid is empty. 11,. referring to the picture in number 1, what is the area of the composite base knowing that the square is empty? 12what is the formula to find the lateral surface area of a cone? (13find the lateral surface area of the cone14what is the lateral surface area shape of the pyramid? what is the formula for its area? 15to find the lateral surface area of the pyramid the length is still needed. calculate the lateral surface length of the pyramid. 16 now that the lateral surface length is known, what is the lateral surface area of the pyramid17. using the lateral surface areas of the cone and pyramid, along with the area of the composite base, what is the total surface area?
Answers: 3
Mathematics, 21.06.2019 22:30
The moats separating people from the animals are 5 m wide for lions and 4 m wide for the elephants. if the lion’s moat is 4 m deep, how deep should the elephants’ moat be?
Answers: 1
Mathematics, 22.06.2019 00:00
The cost of a taxi ride includes an initial charge of $2.00. if a 5km ride cost $6.00 and a 10km ride cost $10.00, determine the cost of a 15km ride.
Answers: 1
Mathematics, 22.06.2019 01:00
X^2/100+y^2/25=1 the length of the major axis is: a)5 b)10 c)20
Answers: 3
You know the right answer?
2020-2021 T-Math-Alg1-T6-CBT: Section
Which system of inequalities describes the graph?
8
8
Questions

Mathematics, 24.03.2020 17:48

Business, 24.03.2020 17:49


English, 24.03.2020 17:49
English, 24.03.2020 17:50

History, 24.03.2020 17:50
Mathematics, 24.03.2020 17:50


