
Mathematics, 04.03.2021 21:00 baseball1525
A farm has two tanks, tank A and tank B, which are being filled with water at constant rates. Tank B already has 150 gallons of water by the time water starts filling in tank A. Consider the graph below which shows the relationship between the amounts of water in tank A and tank B in gallons, and the time elapsed, in hours. Which of the lines shows a proportional relationship, and what is the constant of proportionality? A. Tank B's line shows a proportional relationship, and the constant of proportionality is 150. B. Tank A's line shows a proportional relationship, and the constant of proportionality is 0.02. C. Tank A's line shows a proportional relationship, and the constant of proportionality is 50. D. Tank B's line shows a proportional relationship, and the constant of proportionality is 225.

Answers: 2
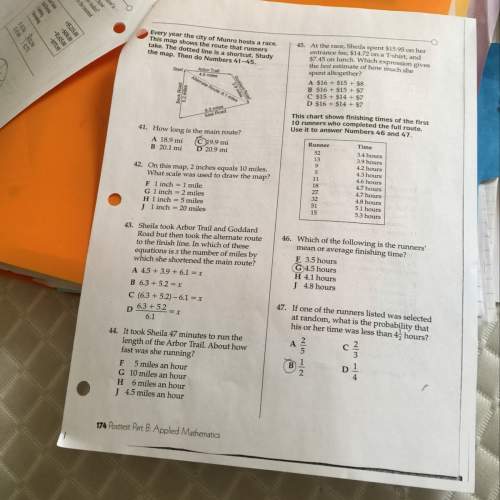


Another question on Mathematics
Mathematics, 20.06.2019 18:04
Which of the following is the formula for the sequence graphed below
Answers: 1
Mathematics, 21.06.2019 16:20
An equation representing lyle’s hedge-trimming business is a = 12n - 300 where a is the amount of profit or loss in dollars and n is the number of hedges trimmed. how would the graph of lyle’s business change if the equation a = 10n - 300 represented his business? the graph would be flatter. the graph would be steeper. the graph would start closer to the origin. the graph would start lower on the y-axis.
Answers: 2
Mathematics, 21.06.2019 18:30
Can someone me out here and the tell me the greatest common factor
Answers: 1
You know the right answer?
A farm has two tanks, tank A and tank B, which are being filled with water at constant rates. Tank B...
Questions


Mathematics, 18.01.2021 23:20

History, 18.01.2021 23:20

Spanish, 18.01.2021 23:20


History, 18.01.2021 23:20
Physics, 18.01.2021 23:20

Physics, 18.01.2021 23:20


