
Mathematics, 04.03.2021 05:20 stranger123
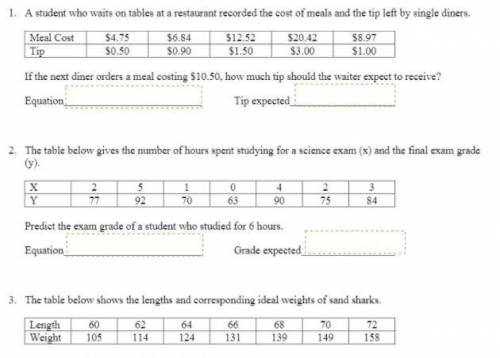
For each of the following, write the prediction equation and then solve the problem, round to the nearest tenth. (Will mark brainliest as soon as possible.)

Answers: 3


Another question on Mathematics
Mathematics, 21.06.2019 15:30
Hurry and answer this! circle x with a radius of 6 units and circle y with a radius of 2 units are shown which steps would prove the circles similar? translate the circles so they share a common center point, and dilate circle y by a scale factor of 4. translate the circles so the center of one circle rests on the edge of the other circle, and dilate circle y by a scale factor of 4. translate the circles so they share a common center point, and dilate circle y by a scale factor of 3. translate the circles so the center of one circle rests on the edge of the other circle, and dilate circle y by a scale factor of 3
Answers: 1
Mathematics, 21.06.2019 16:00
Part one: measurements 1. measure your own height and arm span (from finger-tip to finger-tip) in inches. you will likely need some from a parent, guardian, or sibling to get accurate measurements. record your measurements on the "data record" document. use the "data record" to you complete part two of this project. name relationship to student x height in inches y arm span in inches archie dad 72 72 ginelle mom 65 66 sarah sister 64 65 meleah sister 66 3/4 67 rachel sister 53 1/2 53 emily auntie 66 1/2 66 hannah myself 66 1/2 69 part two: representation of data with plots 1. using graphing software of your choice, create a scatter plot of your data. predict the line of best fit, and sketch it on your graph. part three: the line of best fit include your scatter plot and the answers to the following questions in your word processing document 1. 1. which variable did you plot on the x-axis, and which variable did you plot on the y-axis? explain why you assigned the variables in that way. 2. write the equation of the line of best fit using the slope-intercept formula $y = mx + b$. show all your work, including the points used to determine the slope and how the equation was determined. 3. what does the slope of the line represent within the context of your graph? what does the y-intercept represent? 5. use the line of best fit to you to describe the data correlation.
Answers: 2
Mathematics, 21.06.2019 18:00
1. what expression would be the same as 6x+x+0 2. find the prime factorization of 60 3. write the expression for 6 + x in words.
Answers: 3
Mathematics, 21.06.2019 18:30
Agraphic designer created a logo on eight and a half by 11 inch paper. in order to be placed on a business card, the logo needs to be one and 7/10 inches by 2 and 1/5 in. what is the scale factor of the dilation
Answers: 1
You know the right answer?
For each of the following, write the prediction equation and then solve the problem, round to the ne...
Questions


Business, 11.04.2020 17:56
Mathematics, 11.04.2020 17:57


History, 11.04.2020 17:57
Mathematics, 11.04.2020 17:57

Mathematics, 11.04.2020 17:58

English, 11.04.2020 17:59

Social Studies, 11.04.2020 17:59


