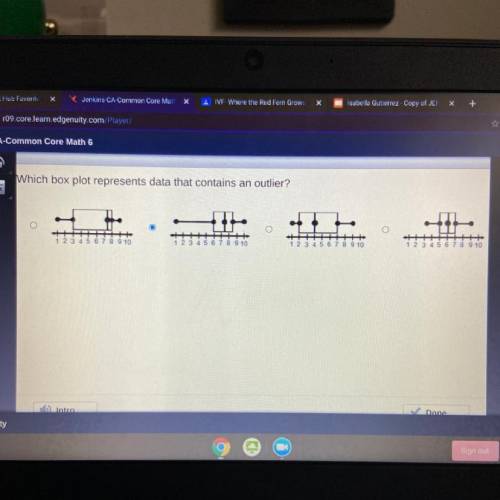
Which box plot represents data that contains an outlier?
1 2 3 4 5 6 7 8 9 10
1 2 3 4 5 6 7 8...

Mathematics, 04.03.2021 01:40 Ruijinzhang3142
Which box plot represents data that contains an outlier?
1 2 3 4 5 6 7 8 9 10
1 2 3 4 5 6 7 8 9 10
1 2 3 4 5 6 7 8 9 10
1 2 3 4 5 6 7 8
I just guessed but if I’m wrong please help

Answers: 1


Another question on Mathematics
Mathematics, 21.06.2019 19:10
1jessica's home town is a mid-sized city experiencing a decline in population. the following graph models the estimated population if the decline continues at the same rate. select the most appropriate unit for the measure of time that the graph represents. a. years b. hours c. days d. weeks
Answers: 2
Mathematics, 21.06.2019 20:00
Apatient is to be given 35 milligrams of demerol every 4 hours. you have demerol 50 milligrams/milliliter in stock. how many milliliters should be given per dose?
Answers: 2
Mathematics, 21.06.2019 23:30
What are the coordinates of the image of p for a dilation with center (0, 0) and scale factor 2
Answers: 1
Mathematics, 22.06.2019 03:00
Find four solutions of the given function. write the solutions as ordered pairs. 4x – y = 4
Answers: 1
You know the right answer?
Questions


History, 22.07.2019 02:50


Chemistry, 22.07.2019 02:50


History, 22.07.2019 02:50
Mathematics, 22.07.2019 02:50


