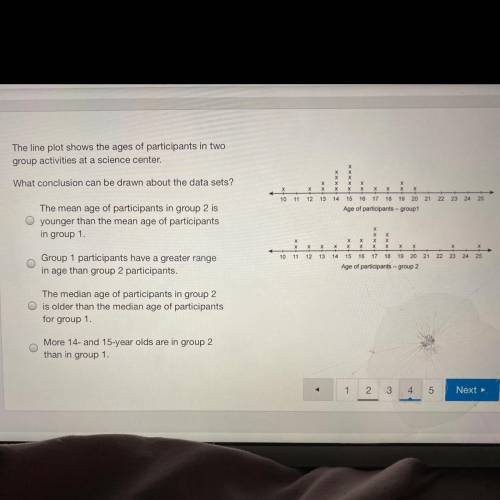
The line plot shows the ages of participants in two
group activities at a science center.
Wha...

Mathematics, 01.03.2021 07:50 anilauferc
The line plot shows the ages of participants in two
group activities at a science center.
What conclusion can be drawn about the data sets?
X
X
х
х
х
X
x
х
19 20 21
10
11
12
13
14
15
16 17
18
22 23
24
25
Age of participants-group1
The mean age of participants in group 2 is
younger than the mean age of participants
in group 1.
x
х
x
x
х
х
х
х
х
х
X
х
Х
12
x
19
х
20 21
10
11
13
14
15
16
17 18
22
23 24
25
Group 1 participants have a greater range
in age than group 2 participants.
Age of participants - group 2
The median age of participants in group 2
is older than the median age of participants
for group 1.
More 14- and 15-year olds are in group 2
than in group 1.


Answers: 1


Another question on Mathematics


Mathematics, 21.06.2019 18:00
Sara can take no more than 22 pounds of luggage on a trip.her suitcase weighs 112 ounces.how many more pounds can she pack without going over the limit?
Answers: 1

Mathematics, 21.06.2019 22:30
Which of the following is an example of a rational number? a. π b. √ 9 c. √ 8 d. 3.8362319
Answers: 1

Mathematics, 22.06.2019 01:00
Luis has a cooler filled with cans of soda.for every 5 cans of coke there are 3 cans of sprite.if there are 25 cans of coke, how mant cans of sprite are there?
Answers: 2
You know the right answer?
Questions


English, 02.02.2021 19:50


Mathematics, 02.02.2021 19:50


English, 02.02.2021 19:50

Mathematics, 02.02.2021 19:50

English, 02.02.2021 19:50


Mathematics, 02.02.2021 19:50


Business, 02.02.2021 19:50


Mathematics, 02.02.2021 19:50


Chemistry, 02.02.2021 19:50

English, 02.02.2021 19:50

Mathematics, 02.02.2021 19:50


