
Mathematics, 28.02.2021 01:50 Lonzo2
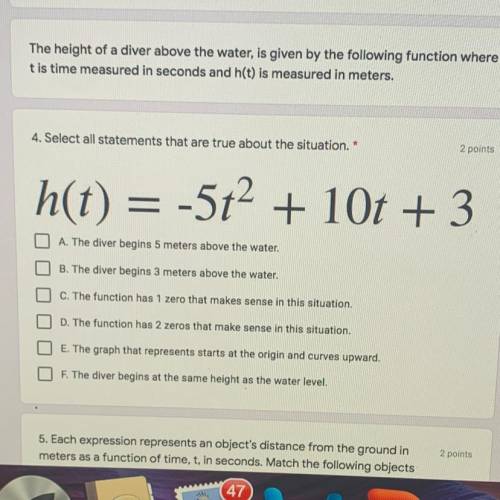
The height of a diver above the water, is given by the following function where
t is time measured in seconds and h(t) is measured in meters.
4. Select all statements that are true about the situation.*
2 points
h(t) = -5t2 + 10t + 3
O A. The diver begins 5 meters above the water.
B. The diver begins 3 meters above the water.
C. The function has 1 zero that makes sense in this situation.
D. The function has 2 zeros that make sense in this situation.
OOL
E. The graph that represents starts at the origin and curves upward.
The diver begins at the same height as the water level.
5. Each expression represents an object's distance from the ground in
2 points

Answers: 3


Another question on Mathematics
Mathematics, 21.06.2019 14:10
5500 dollars is placed in an account with an annual interest rate of 6.5%. to the nearest tenth of a year, how long will it take for the account value to reach 19700 dollars?
Answers: 2
Mathematics, 21.06.2019 15:00
Abag contains 3 red marbles 4 white marbles and 5 blue marbles if one marble is drawn from the bag what is the probability that the marble will be blue
Answers: 1
Mathematics, 21.06.2019 16:00
Part one: measurements 1. measure your own height and arm span (from finger-tip to finger-tip) in inches. you will likely need some from a parent, guardian, or sibling to get accurate measurements. record your measurements on the "data record" document. use the "data record" to you complete part two of this project. name relationship to student x height in inches y arm span in inches archie dad 72 72 ginelle mom 65 66 sarah sister 64 65 meleah sister 66 3/4 67 rachel sister 53 1/2 53 emily auntie 66 1/2 66 hannah myself 66 1/2 69 part two: representation of data with plots 1. using graphing software of your choice, create a scatter plot of your data. predict the line of best fit, and sketch it on your graph. part three: the line of best fit include your scatter plot and the answers to the following questions in your word processing document 1. 1. which variable did you plot on the x-axis, and which variable did you plot on the y-axis? explain why you assigned the variables in that way. 2. write the equation of the line of best fit using the slope-intercept formula $y = mx + b$. show all your work, including the points used to determine the slope and how the equation was determined. 3. what does the slope of the line represent within the context of your graph? what does the y-intercept represent? 5. use the line of best fit to you to describe the data correlation.
Answers: 2
Mathematics, 21.06.2019 20:30
What is always true about a positive integer raised to a negative odd power?
Answers: 1
You know the right answer?
The height of a diver above the water, is given by the following function where
t is time measured...
Questions

Mathematics, 07.04.2020 23:19

Mathematics, 07.04.2020 23:19
Mathematics, 07.04.2020 23:19

Computers and Technology, 07.04.2020 23:19

Mathematics, 07.04.2020 23:19


Spanish, 07.04.2020 23:19
English, 07.04.2020 23:19


