(Graph is in attachment)
Which variable did you plot on the x-axis, and which variable d...

Mathematics, 26.02.2021 19:00 Ciarrathereal
(Graph is in attachment)
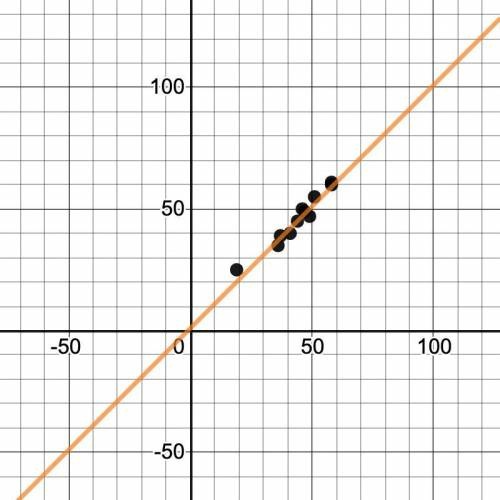
Which variable did you plot on the x-axis, and which variable did you plot on the y-axis? Explain why you assigned the variables in that way.
Write the equation of the line of best fit using the slope-intercept formula y = mx + b. Show all your work, including the points used to determine the slope and how the equation was determined.
What does the slope of the line represent within the context of your graph? What does the y-intercept represent?
Test the residuals of two other points to determine how well the line of best fit models the data.
Use the line of best fit to help you to describe the data correlation.
Using the line of best fit that you found in Part Three, Question 2, approximate how tall is a person whose arm span is 66 inches?
According to your line of best fit, what is the arm span of a 74-inch-tall person?
CHART:
Arm Span (inches)
58
49
51
19
37
44
47
36
41
46
58
Height (inches)
60
47
55
25
39
45
49
35
40
50
61

Answers: 1


Another question on Mathematics
Mathematics, 21.06.2019 15:30
State whether weight is a function of height for the six students and explain. a. yes, height is a function of weight because two students weigh 165 pounds but have different heights. b. no, height is not a function of weight because two students weigh 165 pounds but have different heights. c. yes, weight is a function of height because for each value of height there is one corresponding value of weight. d. no, weight is not a function of height because there is not enough data to determine a function.
Answers: 1
Mathematics, 21.06.2019 20:00
Which of these tools or constructions is used to inscribe a hexagon inside a circle?
Answers: 1
You know the right answer?
Questions

Biology, 27.08.2021 17:10
Biology, 27.08.2021 17:10

Mathematics, 27.08.2021 17:10

Geography, 27.08.2021 17:20
Mathematics, 27.08.2021 17:20


Chemistry, 27.08.2021 17:20
Mathematics, 27.08.2021 17:20


English, 27.08.2021 17:20

Mathematics, 27.08.2021 17:20


