This table shows the profit for a company (in millions of dollars) in different
years.
...

Mathematics, 25.02.2021 03:40 xojade
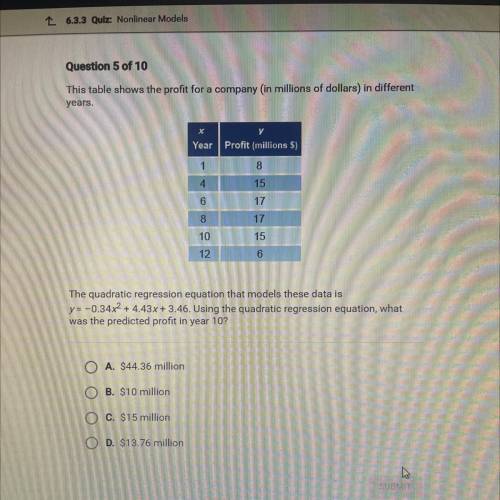
This table shows the profit for a company (in millions of dollars) in different
years.
The quadratic regression equation that models these data is
y=-0.34x2 + 4.43x + 3.46. Using the quadratic regression equation, what
was the predicted profit in year 10?
A. $44.36 million
B. $10 million
C. $15 million
D. $13.76 million

Answers: 1


Another question on Mathematics
Mathematics, 21.06.2019 21:30
Which of the following disjunctions is true? 4 + 4 = 16 or 6 - 5 = 11 4 · 3 = 7 or 3 - 2 = 5 8 - 5 = 13 or 7 · 2 = 12 7 - 4 = 11 or 6 + 3 = 9
Answers: 1
Mathematics, 21.06.2019 21:50
What additional information is needed to prove that the triangles are congruent using the aas congruence theorem? o lolm o oama o zloa zlma o zlao – zlam
Answers: 1
Mathematics, 21.06.2019 22:00
Set $r$ is a set of rectangles such that (1) only the grid points shown here are used as vertices, (2) all sides are vertical or horizontal and (3) no two rectangles in the set are congruent. if $r$ contains the maximum possible number of rectangles given these conditions, what fraction of the rectangles in set $r$ are squares? express your answer as a common fraction.
Answers: 1
Mathematics, 21.06.2019 23:00
The equation shown below represents function f. f(x)= -2x+5 the graph shown below represents function g. which of the following statements is true? a. over the interval [2, 4], the average rate of change of f is the same as the average rate of change of g. the y-intercept of function f is less than the y-intercept of function g. b. over the interval [2, 4], the average rate of change of f is greater than the average rate of change of g. the y-intercept of function f is greater than the y-intercept of function g. c. over the interval [2, 4], the average rate of change of f is the same as the average rate of change of g. the y-intercept of function f is greater than the y-intercept of function g. d. over the interval [2, 4], the average rate of change of f is less than the average rate of change of g. the y-intercept of function f is the same as the y-intercept of function g.
Answers: 1
You know the right answer?
Questions

Biology, 22.11.2019 07:31
Mathematics, 22.11.2019 07:31

History, 22.11.2019 07:31
Mathematics, 22.11.2019 07:31
Mathematics, 22.11.2019 07:31


Physics, 22.11.2019 07:31
Physics, 22.11.2019 07:31
History, 22.11.2019 07:31
Mathematics, 22.11.2019 07:31
Mathematics, 22.11.2019 07:31

Spanish, 22.11.2019 07:31


