
Mathematics, 24.02.2021 20:00 libi052207
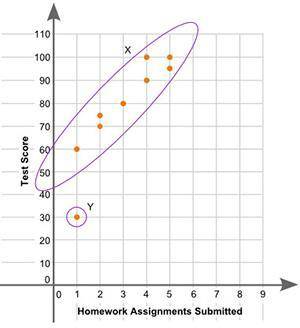
06.01)The scatter plot shows the relationship between the number of homework assignments turned in over a week and the test score for that same week:
A scatter plot is shown. The x-axis is labeled Homework Assignments Submitted and the y-axis is labeled test score. Data points are located at 1 and 30, 2 and 70, 2 and 75, 3 and 80, 5 and 100, 4 and 100, 4 and 90, 5 and 95, and 1 and 60. A circle labeled X surrounds all of the points except 1 and 30. The point 1 and 30 is labeled Y.
Part A: What is the group of points labeled X called? What is the point labeled Y called? Give a possible reason for the presence of point Y. (3 points)
Part B: Describe the association between a student’s test scores and the number of homework assignments submitted. (2 points)

Answers: 2


Another question on Mathematics
Mathematics, 21.06.2019 19:20
Which number line represents the solution set for the inequality - x 24?
Answers: 3
Mathematics, 21.06.2019 22:00
Carla was trying to decide what to do saturday evening. she has $100 available to spend for the evening. she has narrowed her choices down to these events: braves game, a concert of an artist she likes, or the georgia aquarium. admission to the braves game is $25, hot dogs cost $10, sodas cost $5. the concert costs $25 for admission, $20 for a souvernir t-shirt, and $10 for a soda. the georgia aquarium has the show of a lifetime with an all you can eat and drink that costs $100. carla does not want to take any driving chances, so in addition to the cost of the aquarium, she will also need to pay for her uber/lyft, which is $15 each way. which option should carla choose if she wants to spend the least? based on that choice, what then is carla's oppotunity cost? fully explain your answer in at least one paragraph.
Answers: 1
Mathematics, 21.06.2019 22:30
Will mark determine whether the conjecture is true or false. give a counterexample for any false conjecture. given: points r, s, and t conjecture: r, s, and t are coplanar. a) false; the points do not have to be in a straight line. b) true c) false; the points to not have to form right angles. d) false; one point may not be between the other two.
Answers: 1
You know the right answer?
06.01)The scatter plot shows the relationship between the number of homework assignments turned in o...
Questions


Biology, 24.02.2021 18:20


Mathematics, 24.02.2021 18:20
Chemistry, 24.02.2021 18:20

Arts, 24.02.2021 18:20

Social Studies, 24.02.2021 18:20
Mathematics, 24.02.2021 18:20
Mathematics, 24.02.2021 18:20
Social Studies, 24.02.2021 18:20
English, 24.02.2021 18:20


