
Mathematics, 24.02.2021 18:00 andrewbao999
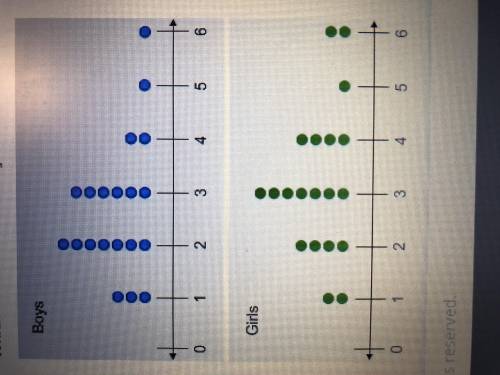
The dot plot shows the number of classes per semester that a group of boys and girls have chosen to take in their freshman year of college. Which statements correctly describe the two data sets?
A. The difference of the means is 1.5.
B. The difference of the means is 0.5.
C. The difference of the means is about one-third the mean absolute deviation of either data set. (This answer was not of the correct ones the first time I took it)
D. The difference of the means is 1.
E. The difference of the means is about one-half the mean absolute deviation of either data set.

Answers: 2


Another question on Mathematics
Mathematics, 21.06.2019 19:00
What is the simplified form of (3.25x10^3)(7.8x10^6) written in scientific notation?
Answers: 1
Mathematics, 21.06.2019 19:30
At 6 1/2 cents per pound of string beans how much does 7 pounds cost
Answers: 1
You know the right answer?
The dot plot shows the number of classes per semester that a group of boys and girls have chosen to...
Questions
Mathematics, 13.07.2021 23:50


Biology, 13.07.2021 23:50
Mathematics, 13.07.2021 23:50
Mathematics, 13.07.2021 23:50
Mathematics, 13.07.2021 23:50
Mathematics, 13.07.2021 23:50


English, 13.07.2021 23:50
English, 13.07.2021 23:50


