
Mathematics, 24.02.2021 16:20 BigDaddy1220
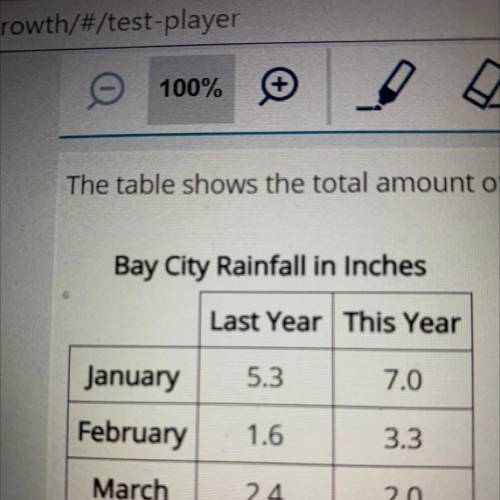
The table shows the total amount of rainfall for Bay City in January, February, and March. The table has data from last year and this year.
Bay City Rainfall in Inches
Last Year This Year
January
5.3
7.0
February 1.6
3.3
March 2.4 2.0
What is the difference between last year's mean for these 3 months and this year's?
O A. 0.9
B. 1.0
C. 1.3
D. 3.0
URGENTT

Answers: 2


Another question on Mathematics
Mathematics, 21.06.2019 17:30
Give the equations of two different lines that are perpendicular to the line 3x + 4y = 7.
Answers: 1
Mathematics, 21.06.2019 23:40
In the diagram, a building cast a 35-ft shadow and a flagpole casts an 8-ft shadow. if the the flagpole is 18 ft tall, how tall is the building? round the the nearest tenth.
Answers: 2
Mathematics, 22.06.2019 00:00
Afair survey question is one that does not encourage biased responses. which survey question is fair? a.) do you agree that only unethical people take credit for other people’s work? b.) have you ever taken credit for somebody else’s work? c.) have you ever engaged in unethical behavior, such as taking credit for somebody else’s work? d.) don’t you think it is unethical to take credit for somebody else’s work?
Answers: 1
You know the right answer?
The table shows the total amount of rainfall for Bay City in January, February, and March. The table...
Questions
Mathematics, 08.12.2020 22:00


Social Studies, 08.12.2020 22:00

History, 08.12.2020 22:00
Mathematics, 08.12.2020 22:00
Social Studies, 08.12.2020 22:00
Social Studies, 08.12.2020 22:00

Mathematics, 08.12.2020 22:00
Mathematics, 08.12.2020 22:00
Mathematics, 08.12.2020 22:00

Mathematics, 08.12.2020 22:00


