Mathematics, 23.02.2021 04:30 Dragon63770
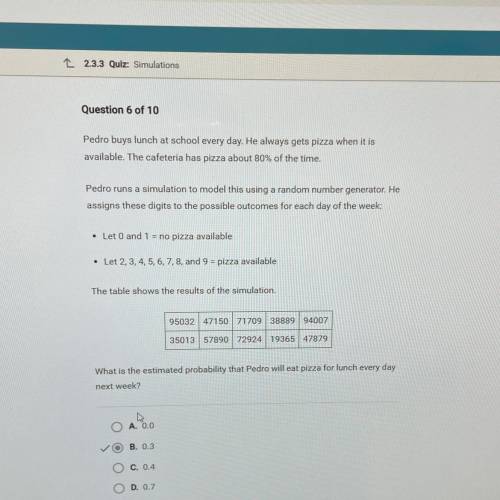
Pedro buys lunch at school every day. He always gets pizza when it is
available. The cafeteria has pizza about 80% of the time.
Pedro runs a simulation to model this using a random number generator. He
assigns these digits to the possible outcomes for each day of the week:
• Let 0 and 1 = no pizza available
Let 2, 3, 4, 5, 6, 7, 8, and 9 = pizza available
The table shows the results of the simulation.
95032 4715071709 3888994007
350135789072924 19365 47879
What is the estimated probability that Pedro will eat pizza for lunch every day
next week?
O A. 0.0
B. 0.3
OC. 0.4
D. 0.7
Answer is B: 0.3
Reason: in each box, there are 5 digits to represent the 5 days in a week. There’s 10 boxes to represents 10 weeks. In each box there’s a chance out of 5 for Pedro to get pizza. You multiply each days possibly of Pedro getting pizza by each other n get about .26 & round it to .3 - hope that helps! ((:


Answers: 3


Another question on Mathematics

Mathematics, 21.06.2019 15:00
1. there are 25 students who started computer programming in elementary school and 25 students who started computer programming in middle school. the first group had a mean final project grade of 95% and the second group had a mean final project grade of 92%. the line plot shows the differences after 10 rerandomizations. determine whether the difference in the means of the two groups is significant based on the line plot. explain your answer.
Answers: 1

Mathematics, 21.06.2019 20:30
Diane’s bank is offering 5% interest, compounded monthly. if diane invests $10,500 and wants $20,000 when she withdrawals, how long should she keep her money in for? round to the nearest tenth of a year.
Answers: 2

Mathematics, 21.06.2019 21:30
Anumber cube is rolled two times in a row. find the probability it will land on 2 on the first roll and a number greater then 4 on the second roll
Answers: 1

Mathematics, 22.06.2019 01:30
Given are five observations for two variables, x and y. xi 1 2 3 4 5 yi 3 7 5 11 14 which of the following is a scatter diagrams accurately represents the data? what does the scatter diagram developed in part (a) indicate about the relationship between the two variables? try to approximate the relationship betwen x and y by drawing a straight line through the data. which of the following is a scatter diagrams accurately represents the data? develop the estimated regression equation by computing the values of b 0 and b 1 using equations (14.6) and (14.7) (to 1 decimal). = + x use the estimated regression equation to predict the value of y when x = 4 (to 1 decimal). =
Answers: 3
You know the right answer?
Pedro buys lunch at school every day. He always gets pizza when it is
available. The cafeteria has...
Questions

English, 25.11.2020 20:00


History, 25.11.2020 20:00

Social Studies, 25.11.2020 20:00

Physics, 25.11.2020 20:00

Mathematics, 25.11.2020 20:00

Mathematics, 25.11.2020 20:10


Health, 25.11.2020 20:10

History, 25.11.2020 20:10


Law, 25.11.2020 20:10

Advanced Placement (AP), 25.11.2020 20:10

Arts, 25.11.2020 20:10

Mathematics, 25.11.2020 20:10


