
Mathematics, 23.02.2021 02:10 fatboi82
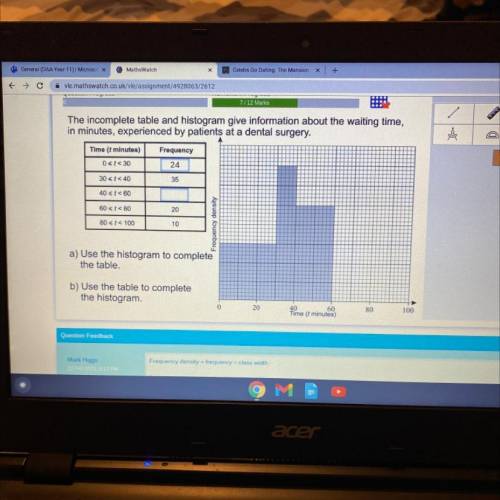
The incomplete table and histogram give information about the waiting time,
in minutes, experienced by patients at a dental surgery.
Time (t minutes)
Frequency
0
30
35
40 t<60
60
20
80 t < 100
10
a) Use the histogram to complete
the table.
b) Use the table to complete
the histogram.
0
20
40
60
Time (t minutes)
80
100
Question Feedback

Answers: 3


Another question on Mathematics
Mathematics, 21.06.2019 16:30
In two or more complete sentences describe how to determine the appropriate model for the set of data, (1,1), (3,2), (6,3), (11,4).
Answers: 1
Mathematics, 21.06.2019 21:50
What is the 17th term in the arithmetic sequence in which a6 is 101 and a9 is 83
Answers: 1
Mathematics, 22.06.2019 05:30
Robert plans to make a box-and-whisker plot of the following set of data. 27, 14, 46, 38, 32, 18, 21 which of the following should robert's box-and-whisker plot look like?
Answers: 1
You know the right answer?
The incomplete table and histogram give information about the waiting time,
in minutes, experienced...
Questions
Mathematics, 11.03.2022 01:00
Mathematics, 11.03.2022 01:00

History, 11.03.2022 01:00
History, 11.03.2022 01:00


Mathematics, 11.03.2022 01:00
Mathematics, 11.03.2022 01:00


Arts, 11.03.2022 01:00
Mathematics, 11.03.2022 01:00


