Graph the system of equations:
y = -2x + 5
- 3x + 3y = -12
What would this graph...

Mathematics, 19.02.2021 23:30 mylanag12
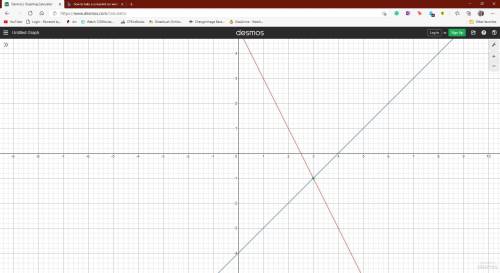
Graph the system of equations:
y = -2x + 5
- 3x + 3y = -12
What would this graph look like? The answer plots at (3,-1) but how would the graph lead up to that point?

Answers: 3


Another question on Mathematics
Mathematics, 21.06.2019 16:10
The number of hours per week that the television is turned on is determined for each family in a sample. the mean of the data is 37 hours and the median is 33.2 hours. twenty-four of the families in the sample turned on the television for 22 hours or less for the week. the 13th percentile of the data is 22 hours. approximately how many families are in the sample? round your answer to the nearest integer.
Answers: 1
Mathematics, 21.06.2019 23:40
Find the amplitude of a sinusoidal function that models this temperature variation
Answers: 2
Mathematics, 22.06.2019 00:00
The graph shows the amount of money noah earned based on the number of lawns he cut. which list shows the dependent quantities in the graph?
Answers: 3
You know the right answer?
Questions

Mathematics, 02.10.2020 15:01
Mathematics, 02.10.2020 15:01

Spanish, 02.10.2020 15:01
Mathematics, 02.10.2020 15:01

Social Studies, 02.10.2020 15:01
Mathematics, 02.10.2020 15:01

Geography, 02.10.2020 15:01

English, 02.10.2020 15:01

Mathematics, 02.10.2020 15:01
Geography, 02.10.2020 15:01
Mathematics, 02.10.2020 15:01


