
Mathematics, 15.02.2021 20:20 michael4443
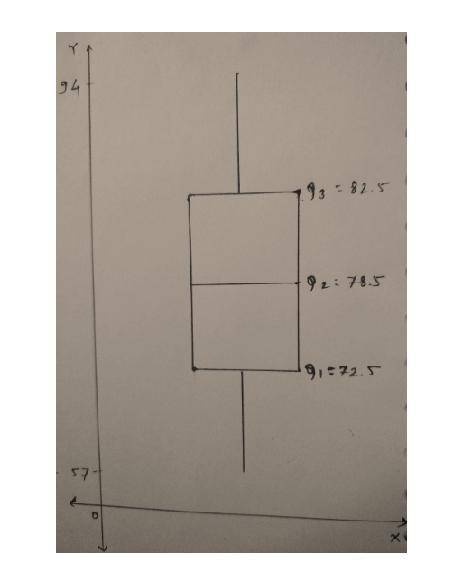
Below are the final exam scores of twenty introductory statistics students.
57, 66, 69, 71, 72, 73, 74, 77, 78, 78, 79, 79, 81, 81, 82, 83, 83, 88, 89, 94
Create a box plot of the distribution of these scores. The five number summary provided below may be useful.
MinQ1 Q2 (Median)Q3 Max
5772.5 78.5 82.5 94
This assignment is to be done in R only.
1. For each of the datasets (i and ii) listed below, find:
a. Mean
b. Median
c. Variance
d. Standard Deviation
i. {0,1,1,4,5,5,6}
ii. {-2,-10,5,4,-1,-9,3}

Answers: 1


Another question on Mathematics
Mathematics, 21.06.2019 17:30
The following frequency table relates the weekly sales of bicycles at a given store over a 42-week period.value01234567frequency367108521(a) in how many weeks were at least 2 bikes sold? (b) in how many weeks were at least 5 bikes sold? (c) in how many weeks were an even number of bikes sold?
Answers: 2
Mathematics, 21.06.2019 19:00
Suppose that one doll house uses the 1 inch scale, meaning that 1 inch on the doll house corresponds to 1/2 foot for life-sized objects. if the doll house is 108 inches wide, what is the width of the full-sized house that it's modeled after? in inches and feet.
Answers: 2
Mathematics, 21.06.2019 22:00
18 16 11 45 33 11 33 14 18 11 what is the mode for this data set
Answers: 2
Mathematics, 22.06.2019 00:30
Describe how to translate the graph of y=/x to obtain the graph of y=/x+5
Answers: 2
You know the right answer?
Below are the final exam scores of twenty introductory statistics students.
57, 66, 69, 71, 72, 73,...
Questions


Computers and Technology, 09.10.2019 18:00

Social Studies, 09.10.2019 18:00

Health, 09.10.2019 18:00

Biology, 09.10.2019 18:00
Mathematics, 09.10.2019 18:00
Mathematics, 09.10.2019 18:00
Computers and Technology, 09.10.2019 18:00

History, 09.10.2019 18:00


