
Mathematics, 12.02.2021 18:20 izhaneedwards
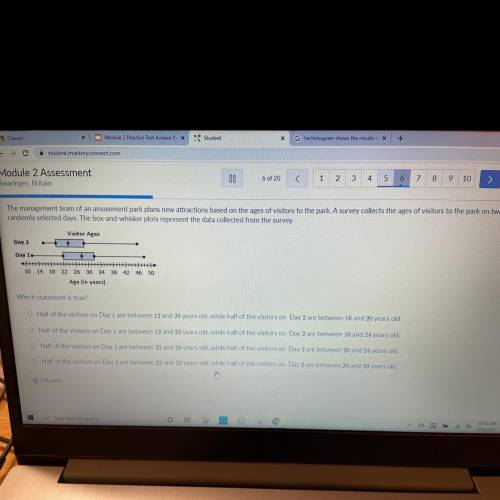
The management team of 20 amusement park plans new attractions based on the ages of visitors to the park A survey collects the ages of visitors to the park on to
randomly selected days. The box-and-whisker plots represent the data collected from the survey.
Visitor Ages
Day 2
Day 1
10 14 18 22 25 30 34 >> 42 46
Age lin years)
Which statement is true
O Half of the visitors on Day 1 are between 12 and 28 years old, while half of the visitors on Day 2 are between 16 and 20 years old
O Half of the visitors on Day 1 are between 12 and 22 years old, while half of the visitors on Day 2 are between 16 and 24 years old.
O Half of the visitors on Day 1 are between 22 and 28 years old, while half of the visitors on Day 2 are between 20 and 24 years old
O Half of the visitors on Day 1 are between 22 and 32 years old, while half of the visitors on Day 2 are between 20
years old

Answers: 3


Another question on Mathematics
Mathematics, 21.06.2019 18:00
The sat and act tests use very different grading scales. the sat math scores follow a normal distribution with mean 518 and standard deviation of 118. the act math scores follow a normal distribution with mean 20.7 and standard deviation of 5. suppose regan scores a 754 on the math portion of the sat. how much would her sister veronica need to score on the math portion of the act to meet or beat regan's score?
Answers: 1
Mathematics, 21.06.2019 21:20
The edge of a cube was found to be 30 cm with a possible error in measurement of 0.4 cm. use differentials to estimate the maximum possible error, relative error, and percentage error in computing the volume of the cube and the surface area of the cube. (round your answers to four decimal places.) (a) the volume of the cube maximum possible error cm3 relative error percentage error % (b) the surface area of the cube maximum possible error cm2 relative error percentage error %
Answers: 3
Mathematics, 22.06.2019 01:00
The correlation coefficient between the number of students and marks obtained in end semester exam. (13 marks) give the statistical meaning of the relationship between the number of students and marks b. obtained in end semester exam. (3 marks) draw the number of students and marks obtained in end semester exam scatter diagram c. (4 marks) check list write your name and id corectly write the question number properly use your own calculator. show all the steps to solve the problems. use the correct formula. answer in provided time. don't use your mobile for any purpose. write your answer up to two decimal places
Answers: 3
Mathematics, 22.06.2019 03:30
Find the value of x. also give me an explanation so i can complete it to other questions as well, : )
Answers: 2
You know the right answer?
The management team of 20 amusement park plans new attractions based on the ages of visitors to the...
Questions


Health, 24.04.2020 20:26

Geography, 24.04.2020 20:26

Chemistry, 24.04.2020 20:26

English, 24.04.2020 20:26

Health, 24.04.2020 20:26

Biology, 24.04.2020 20:26
Mathematics, 24.04.2020 20:26
Mathematics, 24.04.2020 20:26
Mathematics, 24.04.2020 20:26
Mathematics, 24.04.2020 20:26


