
Mathematics, 12.02.2021 17:20 senituliii
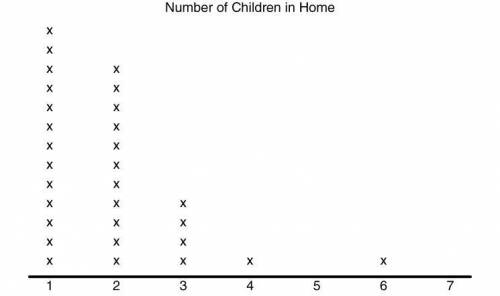
The following dot plot represents a random sample of elementary students and the number of children that live in their home. If this random sample is representative of elementary students in the United States, which of the following inferences can be made from the data? Select all that apply. The majority of the households in the United States, with at least one child, contain less than three children. Very few households in the United States contain four or more children. All households in the United States contain at least one child. None of the households in the United States contain five children.

Answers: 2


Another question on Mathematics
Mathematics, 21.06.2019 21:00
Describe how making an ‘and’ compound sentence effects your solution set
Answers: 1
Mathematics, 21.06.2019 22:00
Which of these triangle pairs can be mapped to each other using a single translation? cof hn
Answers: 2
Mathematics, 21.06.2019 22:00
Arefrigeration system at your company uses temperature sensors fixed to read celsius (°c) values, but the system operators in your control room understand only the fahrenheit scale. you have been asked to make a fahrenheit (°f) label for the high temperature alarm, which is set to ring whenever the system temperature rises above –10°c. what fahrenheit value should you write on the label?
Answers: 3
You know the right answer?
The following dot plot represents a random sample of elementary students and the number of children...
Questions


Physics, 12.05.2021 21:10

Social Studies, 12.05.2021 21:10
Mathematics, 12.05.2021 21:10
Mathematics, 12.05.2021 21:10

Physics, 12.05.2021 21:10

History, 12.05.2021 21:10
Mathematics, 12.05.2021 21:10
History, 12.05.2021 21:10
Mathematics, 12.05.2021 21:10
Mathematics, 12.05.2021 21:10

Mathematics, 12.05.2021 21:10
Mathematics, 12.05.2021 21:10


