
Mathematics, 09.02.2021 06:40 jumoke26
This is a graph of the business cycle.
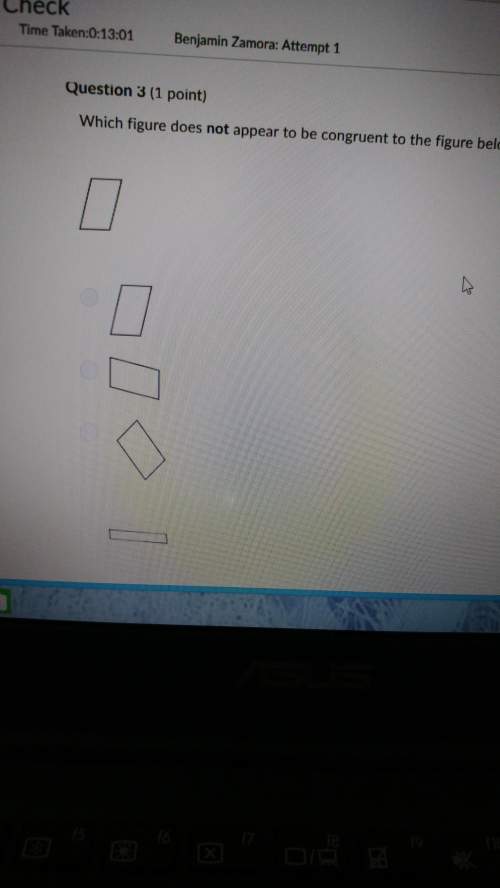
A graph of the business cycle has time on the x-axis. A curve increases slightly and then decreases significantly to the lowest point on the graph. The curve then increases again.
Time is measured along the x-axis. What is measured along the y-axis?
employment levels
prices
economic output
demand

Answers: 1


Another question on Mathematics
Mathematics, 21.06.2019 17:30
For each proportion find the unknown number x 1/5/8=×/15
Answers: 1
Mathematics, 21.06.2019 20:30
Give the functions f(x) = |x + 2| - 3, what is the domain? a,b,c, or d all real numbers x > 2 x < -2 all real numbers and x cannot equal to 2
Answers: 1
Mathematics, 22.06.2019 01:10
Jobs and productivity! how do retail stores rate? one way to answer this question is to examine annual profits per employee. the following data give annual profits per employee (in units of 1 thousand dollars per employee) for companies in retail sales. assume σ ≈ 4.0 thousand dollars. 3.7 6.7 3.6 8.5 7.5 5.9 8.7 6.4 2.6 2.9 8.1 −1.9 11.9 8.2 6.4 4.7 5.5 4.8 3.0 4.3 −6.0 1.5 2.9 4.8 −1.7 9.4 5.5 5.8 4.7 6.2 15.0 4.1 3.7 5.1 4.2 (a) use a calculator or appropriate computer software to find x for the preceding data. (round your answer to two decimal places.) thousand dollars per employee (b) let us say that the preceding data are representative of the entire sector of retail sales companies. find an 80% confidence interval for μ, the average annual profit per employee for retail sales. (round your answers to two decimal places.) lower limit -- thousand dollars upper limit -- thousand dollars (c) let us say that you are the manager of a retail store with a large number of employees. suppose the annual profits are less than 3 thousand dollars per employee. do you think this might be low compared with other retail stores? explain by referring to the confidence interval you computed in part (b). yes. this confidence interval suggests that the profits per employee are less than those of other retail stores. no. this confidence interval suggests that the profits per employee do not differ from those of other retail stores. correct: your answer is correct. (d) suppose the annual profits are more than 6.5 thousand dollars per employee. as store manager, would you feel somewhat better? explain by referring to the confidence interval you computed in part (b). yes. this confidence interval suggests that the profits per employee are greater than those of other retail stores. no. this confidence interval suggests that the profits per employee do not differ from those of other retail stores. (e) find an 95% confidence interval for μ, the average annual profit per employee for retail sales. (round your answers to two decimal places.) lower limit 3.75 incorrect: your answer is incorrect. thousand dollars upper limit 6.41 incorrect: your answer is incorrect. thousand dollars
Answers: 3
Mathematics, 22.06.2019 01:30
△abc is similar to △xyz. also, side ab measures 6 cm, side bc measures 18 cm, and side xy measures 12 cm. what is the measure of side yz ? enter your answer in the box.
Answers: 2
You know the right answer?
This is a graph of the business cycle.
A graph of the business cycle has time on the x-axis. A curv...
Questions


History, 21.11.2019 18:31
Mathematics, 21.11.2019 18:31

Mathematics, 21.11.2019 18:31

Mathematics, 21.11.2019 18:31
Mathematics, 21.11.2019 18:31

Social Studies, 21.11.2019 18:31

Mathematics, 21.11.2019 18:31


