
Mathematics, 03.02.2021 19:40 jakebice3643
Pls help pls/plz/plx
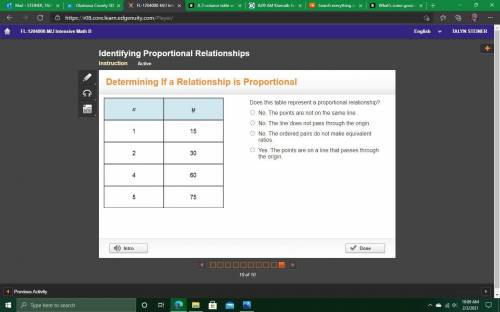
A 2-column table with 4 rows. Column 1 is labeled x with entries 1, 2, 4, 5. Column 2 is labeled y with entries 15, 30, 60, 75.
Does this table represent a proportional relationship?
No. The points are not on the same line.
No. The line does not pass through the origin.
No. The ordered pairs do not make equivalent ratios.
Yes. The points are on a line that passes through the origin.

Answers: 2


Another question on Mathematics
Mathematics, 22.06.2019 00:30
For the sequence [tex]a_{n} = 2n/(n+1)[/tex], what is the value of [tex]a_{10}[/tex]
Answers: 2
Mathematics, 22.06.2019 02:00
Student representatives surveyed their classmates on their preference of a school mascot for a new school. the results are shown in the table below. which pair of samples seems most representative of student preference?
Answers: 2
Mathematics, 22.06.2019 02:30
Atrain traveled for 1.5 hours to the first station, stopped for 30 minutes, then traveled for 4 hours to the final station where it stopped for 1 hour. the total distance traveled is a function of time. which graph most accurately represents this scenario? a graph is shown with the x-axis labeled time (in hours) and the y-axis labeled total distance (in miles). the line begins at the origin and moves upward for 1.5 hours. the line then continues upward at a slow rate until 2 hours. from 2 to 6 hours, the line continues quickly upward. from 6 to 7 hours, it moves downward until it touches the x-axis a graph is shown with the axis labeled time (in hours) and the y axis labeled total distance (in miles). a line is shown beginning at the origin. the line moves upward until 1.5 hours, then is a horizontal line until 2 hours. the line moves quickly upward again until 6 hours, and then is horizontal until 7 hours a graph is shown with the axis labeled time (in hours) and the y-axis labeled total distance (in miles). the line begins at the y-axis where y equals 125. it is horizontal until 1.5 hours, then moves downward until 2 hours where it touches the x-axis. the line moves upward until 6 hours and then moves downward until 7 hours where it touches the x-axis a graph is shown with the axis labeled time (in hours) and the y-axis labeled total distance (in miles). the line begins at y equals 125 and is horizontal for 1.5 hours. the line moves downward until 2 hours, then back up until 5.5 hours. the line is horizontal from 5.5 to 7 hours
Answers: 1
You know the right answer?
Pls help pls/plz/plx
A 2-column table with 4 rows. Column 1 is labeled x with entries 1, 2, 4, 5. C...
Questions
Mathematics, 21.09.2020 21:01


Spanish, 21.09.2020 21:01


Chemistry, 21.09.2020 21:01
History, 21.09.2020 21:01

Mathematics, 21.09.2020 21:01


