
Mathematics, 02.02.2021 02:00 catycait27p5rc5p
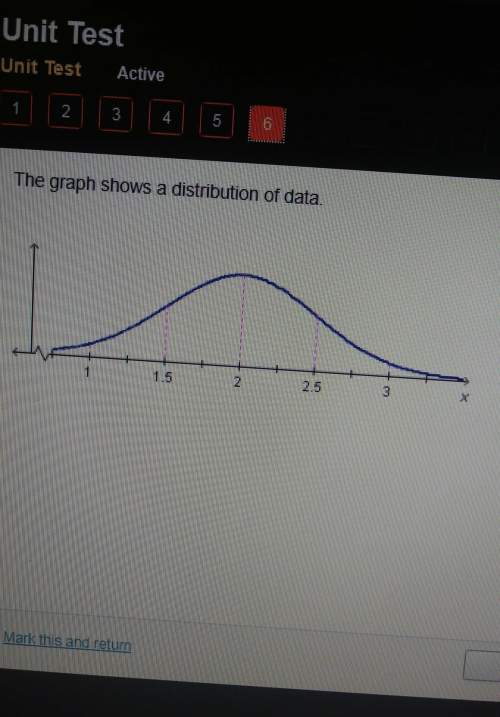
The graph illustrates the distribution of test scores taken by College Algebra students. The maximum possible score on the test was 130, while the mean score was 72 and the standard deviation was 14. (34,13.5,2.35,0.15)
30
44
58
72
86
100
114
Distribution of Test Scores
[Graphs generated by this script: setBorder(10,30,10,5);initPicture(- 3.5,3.5,-.1,.45);line([-17.5,0],[17 .5,0]);line([-3,.02],[-3,-.02]);tex t([-3,-.01],"30","below");line([-2, .02],[-2,-.02]);text([-2,-.01],"44" ,"below");line([-1,.02],[-1,-.02]); text([-1,-.01],"58","below");line([ 0,.02],[0,-.02]);text([0,-.01],"72" ,"below");line([1,.02],[1,-.02]);te xt([1,-.01],"86","below");line([2,. 02],[2,-.02]);text([2,-.01],"100"," below");line([3,.02],[3,-.02]);text ([3,-.01],"114","below");textabs([2 00,0],'Distribution of Test Scores','above');fill="none";path([ [-3.5,0.00087268270248894],[-3.4125 ,0.0011808548546798],[-3.325,0.0015 856655971737],[-3.2375,0.0021130103 340165],[-3.15,0.0027942584387119], [-3.0625,0.00366696237757],[-2.975, 0.0047755266178224],[-2.8875,0.0061 71788271972],[-2.8,0.00791545165049 15],[-2.7125,0.01007431010247],[-2. 625,0.012724181705357],[-2.5375,0.0 15948481633483],[-2.45,0.0198373545 6099],[-2.3625,0.024486296371885],[ -2.275,0.029994206738768],[-2.1875, 0.036460833487169],[-2.1,0.04398359 6355567],[-2.0125,0.052653811509711 ],[-1.925,0.062552378033174],[-1.83 75,0.073745031931229],[-1.75,0.0862 77319562377],[-1.6625,0.10016948780 033],[-1.575,0.1154115290627],[-1.4 875,0.13195865176446],[-1.4,0.14972 746691278],[-1.3125,0.1685931859560 6],[-1.225,0.1883881108589],[-1.137 5,0.20890166300605],[-1.05,0.229882 14264492],[-0.9625,0.25104033647462 ],[-0.875,0.27205500069892],[-0.787 5,0.2925801450485],[-0.7,0.31225393 603],[-0.6125,0.33070893210235],[-0 .525,0.34758326725691],[-0.4375,0.3 6253232013251],[-0.35,0.37524035011 739],[-0.2625,0.3854315552717],[-0. 175,0.39288001279828],[-0.087500000 000002,0.39741800230538],[-2.303712 7760972E-15,0.39894228380404],[0.08 7499999999998,0.39741800230538],[0. 175,0.39288001279828],[0.2625,0.385 4315552717],[0.35,0.37524035011739] ,[0.4375,0.36253232013251],[0.525,0 .34758326725691],[0.6125,0.33070893 210235],[0.7,0.31225393603],[0.7875 ,0.2925801450485],[0.875,0.27205500 069892],[0.9625,0.25104033647462],[ 1.05,0.22988214264492],[1.1375,0.20 890166300605],[1.225,0.188388110858 9],[1.3125,0.16859318595606],[1.4,0 .14972746691278],[1.4875,0.13195865 176446],[1.575,0.1154115290627],[1. 6625,0.10016948780033],[1.75,0.0862 77319562378],[1.8375,0.073745031931 229],[1.925,0.062552378033175],[2.0 125,0.052653811509711],[2.1,0.04398 3596355567],[2.1875,0.0364608334871 7],[2.275,0.029994206738769],[2.362 5,0.024486296371886],[2.45,0.019837 35456099],[2.5375,0.015948481633483 ],[2.625,0.012724181705357],[2.7125 ,0.01007431010247],[2.8,0.007915451 6504916],[2.8875,0.0061717882719721 ],[2.975,0.0047755266178225],[3.062 5,0.0036669623775701],[3.15,0.00279 42584387119],[3.2375,0.002113010334 0166],[3.325,0.0015856655971737],[3 .4125,0.0011808548546798],[3.5,0.00 087268270248895]]);]
What is the approximate percentage students who scored between 58 and 86 on the test?
%
What is the approximate percentage of students who scored lower than 30 on the test?
%
What is the approximate percentage of students who scored less than 44 on the test?
%
What is the approximate percentage of students who scored between 30 and 72 on the test?
%

Answers: 2


Another question on Mathematics
Mathematics, 21.06.2019 23:00
Susie wants to take her friend out for lunch.she wants to spend $9.75 each person. how much will she spend in all.
Answers: 2
Mathematics, 22.06.2019 01:10
Do xuan nam isgoing to invest $1000 at a simple interest rate of 4% how long will it take for the investment to be worth $1040?
Answers: 1
Mathematics, 22.06.2019 04:10
Walgreens sells both kleenex and nyquil. in a random sample of 5000 purchases, it was found that 1200 contained kleenex and 540 contained nyquil. these are not independent because sick people are more likely to buy both and healthy people more likely to buy neither. in looking into that, it was found that 360 purchases contained both. a. make a two-way table to display this information. fill in the table with the missing entries, and be sure your table has row and column totals. b. if we randomly select a purchase that contained kleenex, what is the probability it also contained nyquil? c. what percent of all purchases didn’t contain either product?
Answers: 1
Mathematics, 22.06.2019 05:50
#5 points possible: 3. total attempts: 5 using your calculator, find the range and standard deviation, round to two decimals places: the table below gives the number of hours spent watching tv last week by a sample of 24 children. 76 57 89 73 88 42 31 46 80 42 38 57 49 50 89 36 69 82 27 88 39 89 95 18 range = standard deviation =
Answers: 1
You know the right answer?
The graph illustrates the distribution of test scores taken by College Algebra students. The maximum...
Questions


Mathematics, 15.12.2020 08:10
Mathematics, 15.12.2020 08:10

History, 15.12.2020 08:10
Mathematics, 15.12.2020 08:10

English, 15.12.2020 08:10

Mathematics, 15.12.2020 08:10
Chemistry, 15.12.2020 08:10


