
Mathematics, 01.02.2021 20:40 mikeydog6273
Researchers in New Zealand interviewed 907 drivers at age 21. They had data on traffic accidents and they asked their subjects about marijuana use. Here are data on the numbers of accidents caused by these drivers at age 19, broken down by marijuana use at the same age:
Marijuana Use per year
1-10 11-50 51+
Never times times times
Drivers 452 229 70 156
Accidents caused 59 36 15 50
Required:
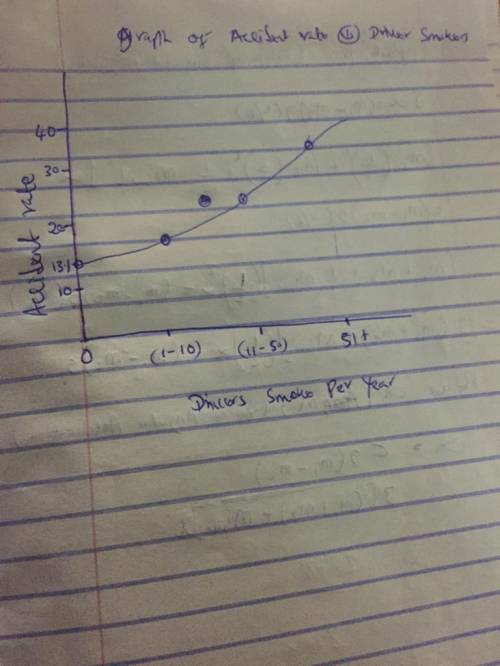
a. Explain carefully why a useful graph must compare rates (accidents per driver) rather than counts of accidents in the four marijuana use classes.
b. Compute the accident rates in the four marijuana use classes. After you have done this, make a graph that displays the accident rate for each class. What do you conclude? (You can’t conclude that marijuana use causes accidents, because risk takers are more likely both to drive aggressively and to use marijuana.)

Answers: 2


Another question on Mathematics
Mathematics, 22.06.2019 03:00
:)i need to know on which ones are corresponding, alternate interior, alternate exterior, or none of these.
Answers: 1
Mathematics, 22.06.2019 04:00
The function below is written in vertex form or intercept form. rewrite them in standard form and show your work. y = -3(x-2)(x-4)
Answers: 2
You know the right answer?
Researchers in New Zealand interviewed 907 drivers at age 21. They had data on traffic accidents and...
Questions
Mathematics, 30.01.2021 03:00
Mathematics, 30.01.2021 03:00


History, 30.01.2021 03:00
Mathematics, 30.01.2021 03:00
Biology, 30.01.2021 03:00


Mathematics, 30.01.2021 03:00
English, 30.01.2021 03:00

Chemistry, 30.01.2021 03:00
English, 30.01.2021 03:00


