
Mathematics, 31.01.2021 23:10 JDKozlova
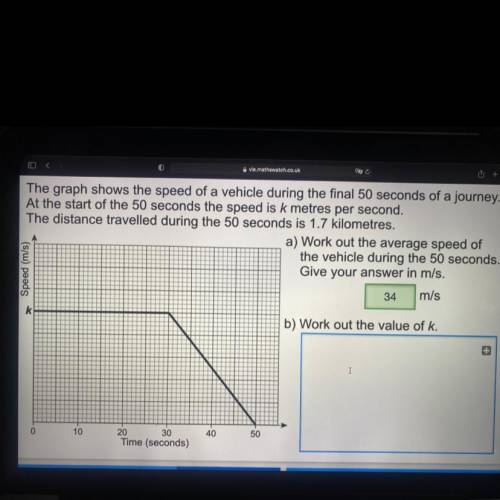
The graph shows the speed of a vehicle during the final 50 seconds of a journey.
At the start of the 50 seconds the speed is k metres per second.
The distance travelled during the 50 seconds is 1.7 kilometres.
a) Work out the average speed of
the vehicle during the 50 seconds.
Give your answer in m/s.
34 m/s
* Speed (m/s)
b) Work out the value of k.
10
40
50
20 30
Time (seconds)

Answers: 3


Another question on Mathematics
Mathematics, 21.06.2019 13:00
Acompany is making new soccer uniforms for a team. the company uses 2.5 yards of fabric for each shirt. the company uses 82.5 yards of fabric to make shirts and shorts for 15 players. the equation and solution below represents the situation. 15(2.5+x)=82.5; x=3 what does the solution, x=3, represent?
Answers: 1
Mathematics, 21.06.2019 19:10
What are the coordinates of the point that is 1/3 of the way from a to b? a (2,-3) b (2,6)
Answers: 3
Mathematics, 21.06.2019 20:30
Stacey filled her 1/2 cup of measuring cup seven times to have enough flour for a cake recipe how much flour does the cake recipe calls for
Answers: 2
You know the right answer?
The graph shows the speed of a vehicle during the final 50 seconds of a journey.
At the start of th...
Questions
Mathematics, 05.12.2019 02:31
Mathematics, 05.12.2019 02:31
Mathematics, 05.12.2019 02:31


Business, 05.12.2019 02:31

Biology, 05.12.2019 02:31

Physics, 05.12.2019 02:31
Mathematics, 05.12.2019 02:31

English, 05.12.2019 02:31

Biology, 05.12.2019 02:31

Social Studies, 05.12.2019 02:31


