
Mathematics, 28.01.2021 17:50 matrixoz1262
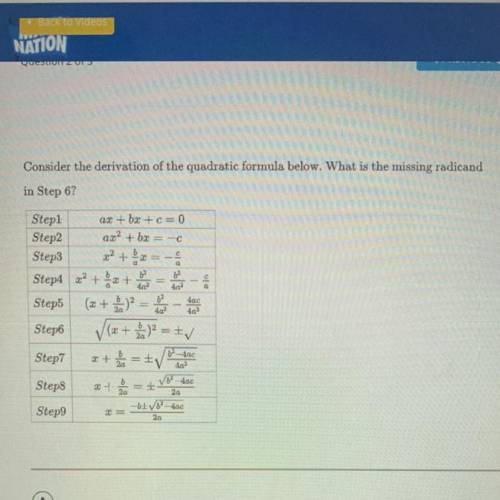
Consider the derivation of the quadratic formula below. What is the missing radicand in Step 6?
A. b^2-4ac/4a
B. b^2+4ac/4a^2
C. b^2-4ac/4a^2
D. b^2+4ac/4a

Answers: 2


Another question on Mathematics
Mathematics, 21.06.2019 21:30
Using pert, adam munson was able to determine that the expected project completion time for the construction of a pleasure yacht is 21 months, and the project variance is 4. a) what is the probability that the project will be completed in 17 months? b) what is the probability that the project will be completed in 20 months? c) what is the probability that the project will be completed in 23 months? d) what is the probability that the project will be completed in 25 months? e) what is the due date that yields a 95% chance of completion?
Answers: 3
Mathematics, 22.06.2019 00:30
Select the correct answer from each drop-down menu. let c(g) be the total cost, including shoe rental, for bowling g games at pin town lanes. c(g) = 5g+3 so, c(6) = 8? 33? 30? or 14? this means that for a $6 shoe rental? for $6 per game? for 6 games? for a total cost of $6? , the games are $8 each? total cost is $33? number of games is 14? or total cost is $30? reset next
Answers: 1
Mathematics, 22.06.2019 01:30
Asample of 200 rom computer chips was selected on each of 30 consecutive days, and the number of nonconforming chips on each day was as follows: the data has been given so that it can be copied into r as a vector. non.conforming = c(10, 15, 21, 19, 34, 16, 5, 24, 8, 21, 32, 14, 14, 19, 18, 20, 12, 23, 10, 19, 20, 18, 13, 26, 33, 14, 12, 21, 12, 27) #construct a p chart by using the following code. you will need to enter your values for pbar, lcl and ucl. pbar = lcl = ucl = plot(non.conforming/200, ylim = c(0,.5)) abline(h = pbar, lty = 2) abline(h = lcl, lty = 3) abline(h = ucl, lty = 3)
Answers: 3
Mathematics, 22.06.2019 03:20
Aconcession manager at yankee stadium wants to know how temperature affects beer sales. she took a sample of 10 games and recorded the number of beers sold and the temperature in the middle of the game. temperature 80 68 78 79 87 74 86 92 77 84 number of beers 20533 1439 13829 21286 30985 17187 30240 87596 9610 28742 a. draw a scatter plot of the data. b. the manager estimates the regression equation to be: numberofbeers = −100, 678 + 1, 513 ∗ temperature draw this on your scatter plot. c. for one of the estimated points, indicate the residual with ei . d. for that same point, indicate what part of the variation is explained by the model with ˆyi − y¯.
Answers: 2
You know the right answer?
Consider the derivation of the quadratic formula below. What is the missing radicand in Step 6?
A....
Questions

Physics, 04.07.2019 06:00

Mathematics, 04.07.2019 06:00
Mathematics, 04.07.2019 06:00
Mathematics, 04.07.2019 06:00

Mathematics, 04.07.2019 06:00

Mathematics, 04.07.2019 06:00

English, 04.07.2019 06:00
Mathematics, 04.07.2019 06:00
Mathematics, 04.07.2019 06:00

Chemistry, 04.07.2019 06:00
Chemistry, 04.07.2019 06:00
Chemistry, 04.07.2019 06:00

Health, 04.07.2019 06:00


