
Mathematics, 23.01.2021 07:20 lesleyy7278
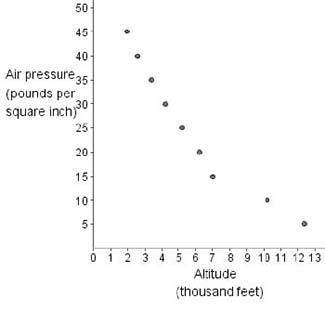
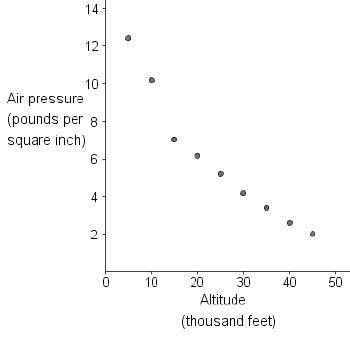
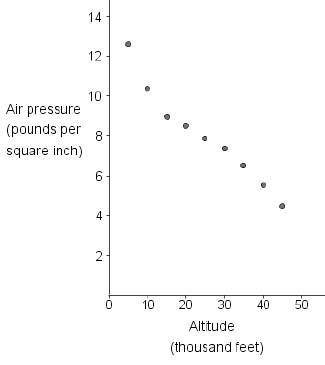
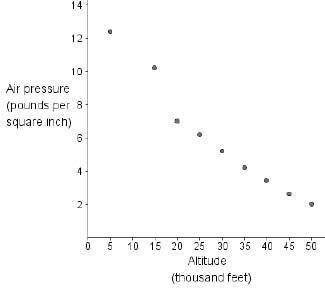
The table below shows the air pressure in pounds per square inch at different altitudes in thousand feet:
Altitude (thousand feet) 5 10 15 20 25 30 35 40 45
Air pressure (pounds per square inch) 12.4 10.2 7 6.2 5.2 4.2 3.4 2.6 2.0
Which scatter plot best represents the data in the table?

Answers: 2


Another question on Mathematics
Mathematics, 21.06.2019 14:30
Given f(t) = 282 - 53 +1, determine the function value f(2). do not include f(z) = in your answer
Answers: 1
Mathematics, 21.06.2019 16:30
Iwant to know what 3g+5h+4g-2h is my teacher is too selfish to tell us
Answers: 1
Mathematics, 21.06.2019 23:30
Find measure angle 1 and measure angle 3 in the kite the diagram is not drawn on the scale
Answers: 1
You know the right answer?
The table below shows the air pressure in pounds per square inch at different altitudes in thousand...
Questions
Mathematics, 28.08.2020 22:01

Health, 28.08.2020 22:01
Mathematics, 28.08.2020 22:01

Mathematics, 28.08.2020 22:01
Mathematics, 28.08.2020 22:01
Mathematics, 28.08.2020 22:01

History, 28.08.2020 22:01


Chemistry, 28.08.2020 22:01


