
Mathematics, 21.01.2021 08:10 keidyhernandezm
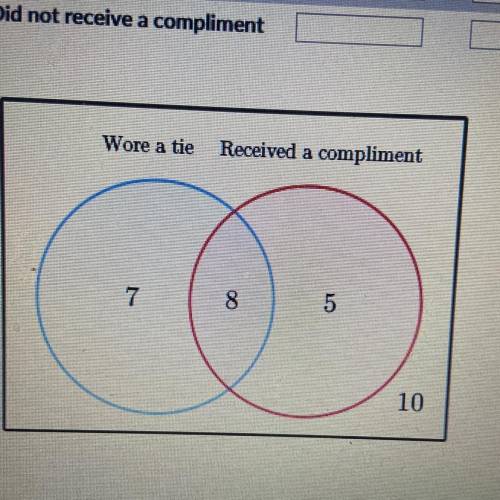
Aditya tracked whether he wore a tie and whether he received a compliment on his outfit for 30 days. The Venn
diagram below shows the data that he collected.
Complete the following two-way frequency table.
Wore a tie
Did not wear a tie
Received a compliment
Did not receive a compliment
Please answer I need help

Answers: 3


Another question on Mathematics
Mathematics, 20.06.2019 18:04
The parking lot of a store has the shape shown. all angles are right angles. what is the area of the parking lot?
Answers: 3
Mathematics, 21.06.2019 19:30
The length of a shadow of the building is 36m. the length of the pole, which is perpendicular to the ground, is 1.9m. the length of the pole's shadow is 1.52m. what is the height of the building?
Answers: 1
Mathematics, 22.06.2019 00:00
The graph shows the amount of money noah earned based on the number of lawns he cut. which list shows the dependent quantities in the graph?
Answers: 3
Mathematics, 22.06.2019 00:30
What is the value of the discrimination for the quadratic equation 0=×2+2+×2
Answers: 2
You know the right answer?
Aditya tracked whether he wore a tie and whether he received a compliment on his outfit for 30 days....
Questions
Mathematics, 02.10.2020 09:01

World Languages, 02.10.2020 09:01


Mathematics, 02.10.2020 09:01
Mathematics, 02.10.2020 09:01


Geography, 02.10.2020 09:01
Geography, 02.10.2020 09:01
History, 02.10.2020 09:01

Biology, 02.10.2020 09:01

Social Studies, 02.10.2020 09:01

English, 02.10.2020 09:01
Mathematics, 02.10.2020 09:01

Mathematics, 02.10.2020 09:01


