
Mathematics, 19.01.2021 02:10 babyskitt
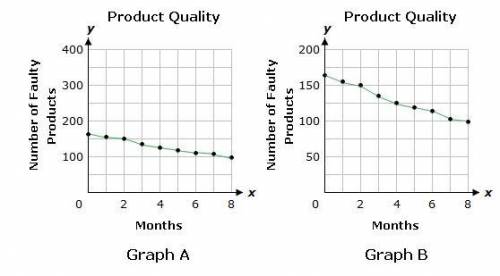
The graphs below show the number of faulty products, y, produced by a company for the first eight months since production started. Both graphs show the same information.
To support her discussion, it would be best for Alex to use _ for her presentation.
Alex should use this graph for her presentation because the number of faulty products _ on this graph.

Answers: 3


Another question on Mathematics
Mathematics, 21.06.2019 17:00
You are a clerk at convenience store. a customer owes 11.69 for a bag of potatoes chips. she gives you a five dollar bill. how much change should the customer receive?
Answers: 1
Mathematics, 21.06.2019 20:20
Elena is paid a constant rate for each hour she works. the table shows the amounts of money that elena earned for various amounts of time that she worked.
Answers: 2
You know the right answer?
The graphs below show the number of faulty products, y, produced by a company for the first eight mo...
Questions
Mathematics, 03.12.2020 22:50

Engineering, 03.12.2020 22:50

Chemistry, 03.12.2020 22:50
Mathematics, 03.12.2020 22:50
Mathematics, 03.12.2020 22:50

French, 03.12.2020 22:50
Mathematics, 03.12.2020 22:50

Social Studies, 03.12.2020 22:50
Mathematics, 03.12.2020 22:50

Advanced Placement (AP), 03.12.2020 22:50

English, 03.12.2020 22:50
History, 03.12.2020 22:50

Spanish, 03.12.2020 22:50
Mathematics, 03.12.2020 22:50


