
Mathematics, 18.01.2021 08:10 dnarioproctor
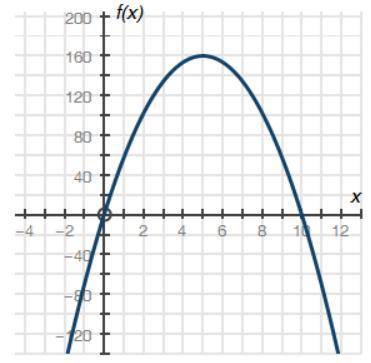
The graph below shows a company's profit f(x), in dollars, depending on the price of pencils x, in dollars, sold by the company:
Graph of quadratic function f of x having x intercepts at ordered pairs negative 0, 0 and 10, 0. The vertex is at 5, 160.
Part A: What do the x-intercepts and maximum value of the graph represent? What are the intervals where the function is increasing and decreasing, and what do they represent about the sale and profit?
Part B: What is an approximate average rate of change of the graph from x = 2 to x = 5, and what does this rate represent?
Part C: Describe the constraints of the domain.

Answers: 2


Another question on Mathematics
Mathematics, 20.06.2019 18:04
Solve the inequality. graph the solution. 6q< −18 the solution is .
Answers: 3
Mathematics, 21.06.2019 13:30
Ben wants to play a carnival game that costs $2. in his pocket he has 5 red tickets worth 35 cents each, and 15 blue tickets worth 10 cents each. which of the following systems of inequalities correctly represents the constraints on the variables in this problem? let represent the red tickets and b represent the blue tickets.
Answers: 1
Mathematics, 21.06.2019 16:30
Diana is painting statues she has 7/8 of a liter of paint each statue requires 1/20 of a liter of paint how many statues can she paint?
Answers: 3
Mathematics, 21.06.2019 16:30
What could explain what happened when the time was equal to 120 minutes
Answers: 2
You know the right answer?
The graph below shows a company's profit f(x), in dollars, depending on the price of pencils x, in d...
Questions

Spanish, 23.09.2020 17:01


Geography, 23.09.2020 17:01


English, 23.09.2020 17:01


History, 23.09.2020 17:01
Mathematics, 23.09.2020 17:01


