The dot plot shows the number of hours students in the
band practiced their instruments.
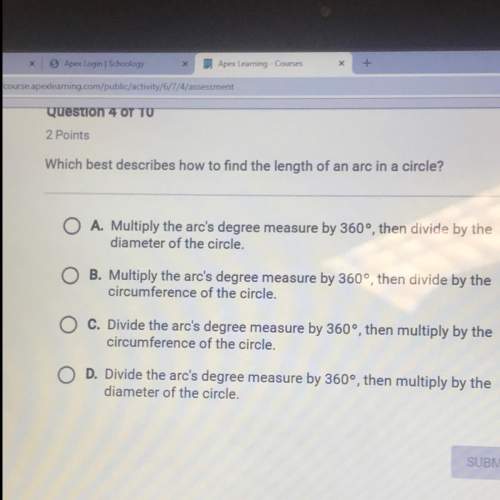
Whic...

Mathematics, 17.01.2021 09:00 quinnie48
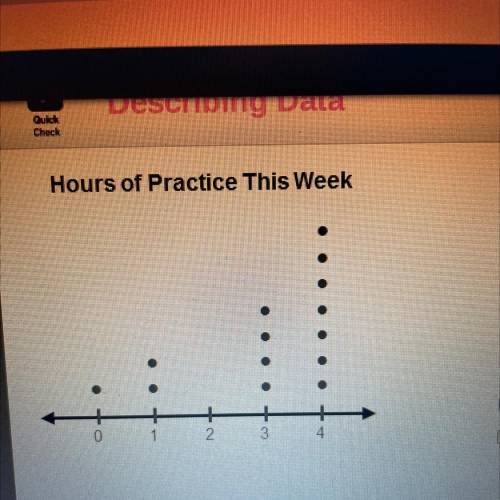
The dot plot shows the number of hours students in the
band practiced their instruments.
Which describe the dot plot? Select all that apply.
O There is a cluster from 3 to 4.
O There is a gap between 1 and 3.
There is a peak at 4.
O The data shows symmetry.
O The data is skewed left.
The data is skewed right.

Answers: 1


Another question on Mathematics
Mathematics, 21.06.2019 17:00
During your cycling trip, you and your friends often stayed in hostels. the prices of these are listed below. hostel standard room (price per night) with breakfast (price per night) super sleep hostels £22.45 £28.65 normandy nights £18.55 £25 zzzola hostels £24.50 £30.99 belgian beds £11.20 £18.55 night-time rest days ? £33 what is the range in cost for a single night, including both standard room prices and with breakfast prices?
Answers: 1
Mathematics, 21.06.2019 21:00
Louis wants to carpet the rectangular floor of his basement the basement has an area of 864 square feet the width of the basement is 2/3 its length what is the length of lewis's basement
Answers: 2
Mathematics, 22.06.2019 02:00
Grant simplified the expression 1.5(-3.2 + 2.5) his work is shown below explain the error in grants work
Answers: 1
Mathematics, 22.06.2019 02:00
Pls what is the relative minimum of the function? enter your answer in the box
Answers: 3
You know the right answer?
Questions

Geography, 07.07.2019 14:00

English, 07.07.2019 14:00

History, 07.07.2019 14:00


History, 07.07.2019 14:00

Health, 07.07.2019 14:00
History, 07.07.2019 14:00
Chemistry, 07.07.2019 14:00
Biology, 07.07.2019 14:00
Mathematics, 07.07.2019 14:00


