Which statement is NOT true?
The side-by-side dotplot below displays the arm spans,
in centim...

Mathematics, 14.01.2021 09:30 dfbernalloboguerrero
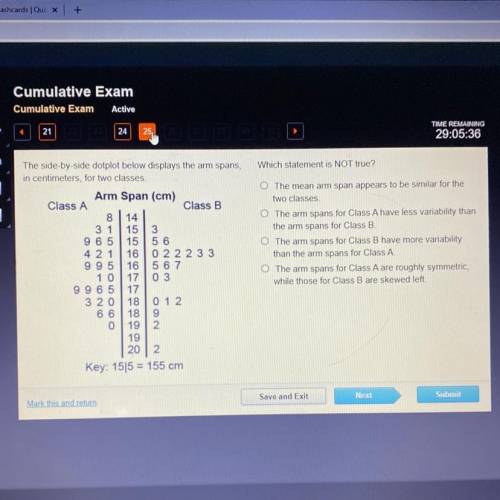
Which statement is NOT true?
The side-by-side dotplot below displays the arm spans,
in centimeters, for two classes
Arm Span (cm)
Class A
Class B
8 14
31 153
9 6 5 15 5 6
4 2 1 16 0 2 2 2 3 3
9 95 16 5 6 7
10 17 0 3
9 9 6 5 17
320 18 012
66
189
0 19 2.
19
20 2
Key: 15/5 = 155 cm
O The mean arm span appears to be similar for the
two classes
O The arm spans for Class A have less variability than
the arm spans for Class B
O The arm spans for Class B have more variability
than the arm spans for Class A
O The arm spans for Class A are roughly symmetric,
while those for Class B are skewed left.
Save and Exit
Next
Submit
Mark this and retum

Answers: 1


Another question on Mathematics
Mathematics, 21.06.2019 15:00
The data shown in the table below represents the weight, in pounds, of a little girl, recorded each year on her birthday. age (in years) weight (in pounds) 2 32 6 47 7 51 4 40 5 43 3 38 8 60 1 23 part a: create a scatter plot to represent the data shown above. sketch the line of best fit. label at least three specific points on the graph that the line passes through. also include the correct labels on the x-axis and y-axis. part b: algebraically write the equation of the best fit line in slope-intercept form. include all of your calculations in your final answer. part c: use the equation for the line of best fit to approximate the weight of the little girl at an age of 14 years old.
Answers: 3
Mathematics, 21.06.2019 15:10
Solve the system by the elimination method. x + y - 6 = 0 x - y - 8 = 0 when you eliminate y , what is the resulting equation? 2x = -14 2x = 14 -2x = 14
Answers: 2
Mathematics, 21.06.2019 17:30
The table shows the balance of a money market account over time. write a function that represents the balance y(in dollars) after t years.
Answers: 2
Mathematics, 21.06.2019 23:00
The weight of a radioactive isotope was 96 grams at the start of an experiment. after one hour, the weight of the isotope was half of its initial weight. after two hours, the weight of the isotope was half of its weight the previous hour. if this pattern continues, which of the following graphs represents the weight of the radioactive isotope over time? a. graph w b. graph x c. graph y d. graph z
Answers: 2
You know the right answer?
Questions
Mathematics, 23.02.2021 01:40

History, 23.02.2021 01:40


Physics, 23.02.2021 01:40

Mathematics, 23.02.2021 01:40
English, 23.02.2021 01:40

Geography, 23.02.2021 01:40
History, 23.02.2021 01:40
Mathematics, 23.02.2021 01:40
Mathematics, 23.02.2021 01:40


