Either Table A or Table B shows a proportional relationship
Table A
x
Plot the points f...

Mathematics, 14.01.2021 01:20 jaimon1016
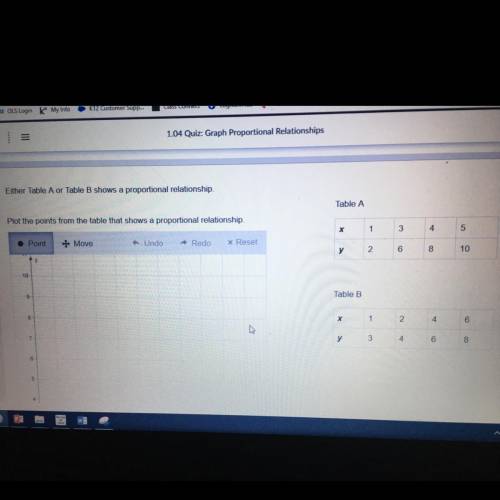
Either Table A or Table B shows a proportional relationship
Table A
x
Plot the points from the table that shows a proportional relationship
4
5
3
1 2
Undo
→ Redo
x Reset
Point + Move
6
у
10
8
10
Table B
9
1
2
4
6
у
3
4
6
8
7
6

Answers: 1


Another question on Mathematics
Mathematics, 21.06.2019 14:00
Find an equation of the line perpendicular to the graph.
Answers: 3
Mathematics, 21.06.2019 19:10
Angle xyz is formed by segments xy and yz on the coordinate grid below: a coordinate plane is shown. angle xyz has endpoints at 3 comma negative 1 and 6 negative 2 and 3 comma negative 3 and measures 36.87 degrees. angle xyz is rotated 270 degrees counterclockwise about the origin to form angle x′y′z′. which statement shows the measure of angle x′y′z′?
Answers: 2
Mathematics, 21.06.2019 19:30
The position of a moving particle is given by the position function: f(t)=-9t-t^2-0.2t^3+0.1t^4 0 a. at what time does the particle reverse direction? b. when is the displacement positive? (round one decimal place and answer in interval notation) c. when is the displacement negative? (round one decimal place and answer in interval notation) d. when is the particle’s acceleration positive? (round one decimal place and answer in interval notation) e. when is the particle’s acceleration negative? (round one decimal place and answer in interval notation)
Answers: 3
Mathematics, 21.06.2019 21:30
Create a graph for the demand for starfish using the following data table: quantity/price of starfish quantity (x axis) of starfish in dozens price (y axis) of starfish per dozen 0 8 2 6 3 5 5 2 7 1 9 0 is the relationship between the price of starfish and the quantity demanded inverse or direct? why? how many dozens of starfish are demanded at a price of five? calculate the slope of the line between the prices of 6 (quantity of 2) and 1 (quantity of 7) per dozen. describe the line when there is a direct relationship between price and quantity.
Answers: 3
You know the right answer?
Questions
Mathematics, 01.06.2021 09:10
Mathematics, 01.06.2021 09:10


Computers and Technology, 01.06.2021 09:10

Mathematics, 01.06.2021 09:10
Mathematics, 01.06.2021 09:10

Mathematics, 01.06.2021 09:10

Chemistry, 01.06.2021 09:10
History, 01.06.2021 09:10


