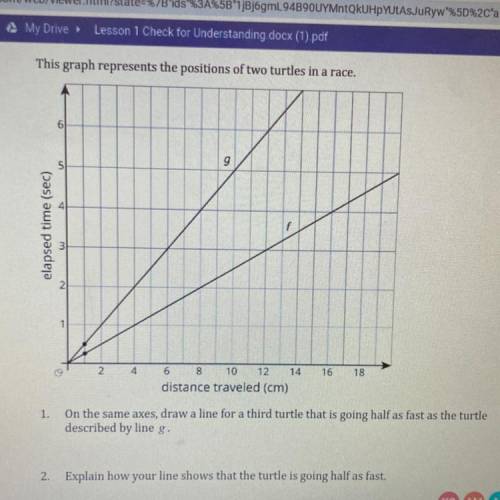
This graph represents the positions of two turtles in a race.
9
5
elapsed time (sec)
3
2
2
18
4
16
6 8 10 12 14
distance traveled (cm)
1. On the same axes, draw a line for a third turtle that is going half as fast as the turtle
described by line g.
2.
Explain how your line shows that the turtle is going half as fast.