
Mathematics, 05.01.2021 01:00 jamayeah02
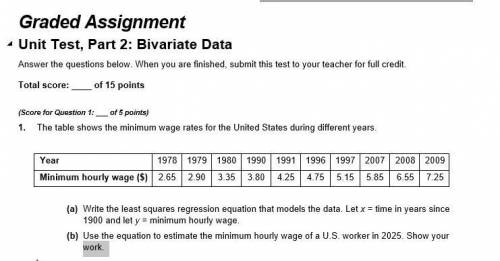
1. The table shows the minimum wage rates for the United States during different years.
Year 1978 1979 1980 1990 1991 1996 1997 2007 2008 2009
Minimum hourly wage ($) 2.65 2.90 3.35 3.80 4.25 4.75 5.15 5.85 6.55 7.25
(a) Write the least squares regression equation that models the data. Let x = time in years since 1900 and let y = minimum hourly wage.
(b) Use the equation to estimate the minimum hourly wage of a U. S. worker in 2025. Show your work.

Answers: 1


Another question on Mathematics
Mathematics, 21.06.2019 18:30
The median of a data set is the measure of center that is found by adding the data values and dividing the total by the number of data values that is the value that occurs with the greatest frequency that is the value midway between the maximum and minimum values in the original data set that is the middle value when the original data values are arranged in order of increasing (or decreasing) magnitude
Answers: 3
Mathematics, 21.06.2019 20:00
Anature center offer 2 guided walks. the morning walk is 2/3 miles. the evening walk is 3/6 mile. which is shorter
Answers: 1
Mathematics, 21.06.2019 22:00
Which is the correct first step in finding the area of the base of a cylinder with a volume of 26x cubic meters and a height of 6.5 meters? v=bh 6.5=b(26x) v=bh v=26pi+(6.5) v=bh v=26pi(6.5) v=bh 26pi=b(6.5)
Answers: 1
Mathematics, 21.06.2019 23:30
In the diagram, ab is tangent to c, ab = 4 inches, and ad = 2 inches. find the radius of the circle.
Answers: 1
You know the right answer?
1. The table shows the minimum wage rates for the United States during different years.
Year 1978 1...
Questions
Mathematics, 19.02.2021 18:30

Social Studies, 19.02.2021 18:30

Mathematics, 19.02.2021 18:30

Mathematics, 19.02.2021 18:30


History, 19.02.2021 18:30

Biology, 19.02.2021 18:30

Computers and Technology, 19.02.2021 18:30
Physics, 19.02.2021 18:30

Health, 19.02.2021 18:30
History, 19.02.2021 18:30


