Mathematics, 04.01.2021 20:40 selenamoreno8713
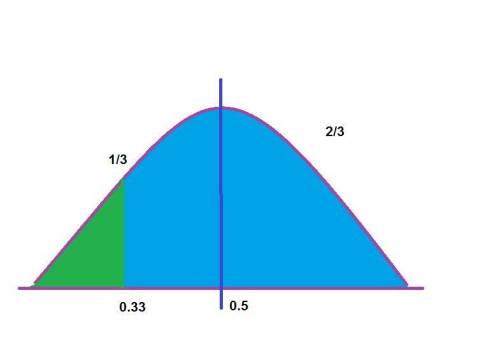
Suppose over several years of offering AP Statistics, a high school finds that final exam scores are normally distributed with a mean of 78 and a standard deviation of 6.a. What are the mean, standard deviation, and shape of the distribution of x-bar for n = 50?b. What’s the probability a sample of scores will have a mean greater than 80?c. Sketch the distribution curve for part B, showing the area that represents the probability you found.

Answers: 1


Another question on Mathematics

Mathematics, 21.06.2019 17:00
Given f(x)=2x^2-8x+6 and g(x)=3x-1 find f(x) +g(x) a. 2x^2+5x+5 b.2x^2-11x+7 c. 2x^2-5x+5 d.2x^2-5x-5
Answers: 1


Mathematics, 21.06.2019 23:30
The points (1, 7) and (0, 2) fall on a particular line. what is its equation in slope-intercept form?
Answers: 1

You know the right answer?
Suppose over several years of offering AP Statistics, a high school finds that final exam scores are...
Questions

Arts, 12.01.2021 20:10

Social Studies, 12.01.2021 20:10


Mathematics, 12.01.2021 20:10

Mathematics, 12.01.2021 20:20


English, 12.01.2021 20:20


History, 12.01.2021 20:20

Mathematics, 12.01.2021 20:20


Chemistry, 12.01.2021 20:20


Health, 12.01.2021 20:20


