
Mathematics, 03.01.2021 05:40 graymonky12
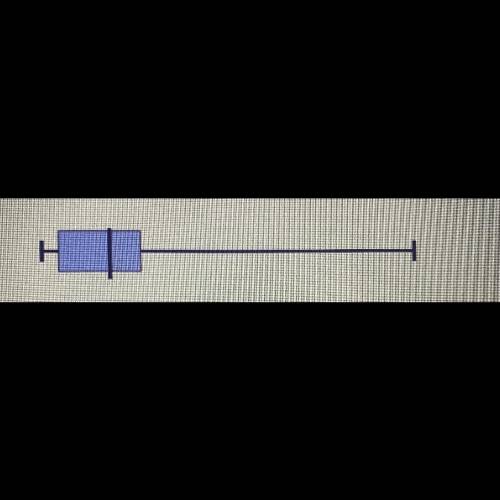
what can you say about the data displayed in the box plot?
a. the mean and median are about the same
b. the data is skewed to the left
c. the mean is less than the median
d. the data is skewed to the right

Answers: 2


Another question on Mathematics
Mathematics, 21.06.2019 15:20
Angle mno is s rotated 180 degrees counterclockwise about the origin to form angle m’n’o’. which statement shows the measure of angle m’n’o’?
Answers: 1
Mathematics, 21.06.2019 21:00
Two cars which are 40 miles apart start moving simultaneously in the same direction with constant speeds. if the speed of the car which is behind is 56 mph and the speed of the other car is 48 mph, how many hours will it take for the car which is behind to catch up the car ahead of it?
Answers: 2
Mathematics, 21.06.2019 21:10
The equation |pl = 2 represents the total number of points that can be earned or lost during one turn of a game. which best describes how many points can be earned or lost during one turn? o o -2 2 oor 2 -2 or 2 o
Answers: 1
Mathematics, 21.06.2019 22:00
After a dreary day of rain, the sun peeks through the clouds and a rainbow forms. you notice the rainbow is the shape of a parabola. the equation for this parabola is y = -x2 + 36. graph of a parabola opening down at the vertex 0 comma 36 crossing the x–axis at negative 6 comma 0 and 6 comma 0. in the distance, an airplane is taking off. as it ascends during take-off, it makes a slanted line that cuts through the rainbow at two points. create a table of at least four values for the function that includes two points of intersection between the airplane and the rainbow. analyze the two functions. answer the following reflection questions in complete sentences. what is the domain and range of the rainbow? explain what the domain and range represent. do all of the values make sense in this situation? why or why not? what are the x- and y-intercepts of the rainbow? explain what each intercept represents. is the linear function you created with your table positive or negative? explain. what are the solutions or solution to the system of equations created? explain what it or they represent. create your own piecewise function with at least two functions. explain, using complete sentences, the steps for graphing the function. graph the function by hand or using a graphing software of your choice (remember to submit the graph).
Answers: 2
You know the right answer?
what can you say about the data displayed in the box plot?
a. the mean and median are about the sa...
Questions


Business, 27.08.2019 02:00

Computers and Technology, 27.08.2019 02:00

Geography, 27.08.2019 02:00

Health, 27.08.2019 02:00


Social Studies, 27.08.2019 02:00


