
Mathematics, 18.12.2020 20:50 meramera50
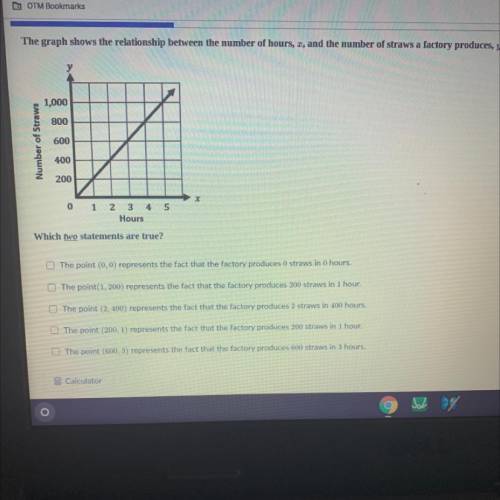
The graph shows the relationship between the number of hours, I, and the number of straws a factory produces, y.
1,000
800
Number of Straws
600
V
400
200
0
1 2 3 4 5
Hours
Which two statements are true?
The point (0,0) represents the fact that the factory produces 0 straws in 0 hours.
The point(1, 200) represents the fact that the factory produces 200 straws in 1 hour.
The point (2,400) represents the fact that the factory produces 2 straws in 400 hours.
The point (200, 1) represents the fact that the factory produces 200 straws in 1 hour
The point (600,3) represents the fact that the factory produces 600 straws in 3 hours.
m Calculator

Answers: 1


Another question on Mathematics
Mathematics, 21.06.2019 18:30
Someone answer this asap rn for ! a discount store’s prices are 25% lower than department store prices. the function c(x) = 0.75x can be used to determine the cost c, in dollars, of an item, where x is the department store price, in dollars. if the item has not sold in one month, the discount store takes an additional 20% off the discounted price and an additional $5 off the total purchase. the function d(y) = 0.80y - 5 can be used to find d, the cost, in dollars, of an item that has not been sold for a month, where y is the discount store price, in dollars. create a function d(c(x)) that represents the final price of an item when a costumer buys an item that has been in the discount store for a month. d(c(x)) =
Answers: 1
Mathematics, 21.06.2019 21:20
Do you mind if you guys me with this question i’m on number 8
Answers: 1
Mathematics, 22.06.2019 01:00
Given the net of the rectangular prism, what is its surface area?
Answers: 1
You know the right answer?
The graph shows the relationship between the number of hours, I, and the number of straws a factory...
Questions
Mathematics, 17.12.2019 18:31

Mathematics, 17.12.2019 18:31
Mathematics, 17.12.2019 18:31


Mathematics, 17.12.2019 18:31


Computers and Technology, 17.12.2019 18:31


