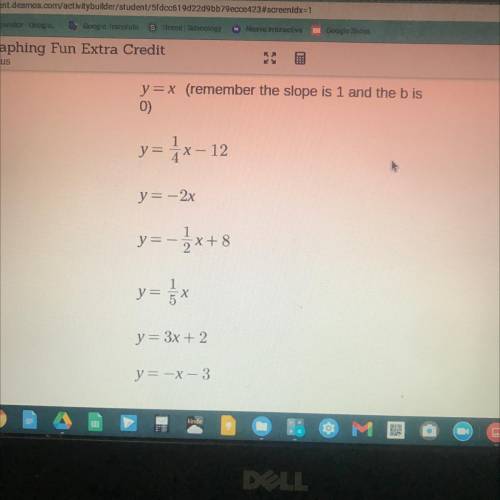
Please plot two points for each of the lines
and then use the line tool to go through the
who...

Mathematics, 18.12.2020 18:20 emanihackle9
Please plot two points for each of the lines
and then use the line tool to go through the
whole grid. Each line should go through only
one penguin. I know using a line tool isn't
ideal, and it might not be perfect. I will look
to see if you plotted the points correctly.
There will be 4 penguins that you don't catch
and that's okay. :) I thought 8 penguins was
good enough for this lesson.
I need help asap plz less then 12 min plz
I need this quick

Answers: 2


Another question on Mathematics
Mathematics, 21.06.2019 14:30
In the image, point a marks the center of the circle. which two lengths must form a ratio of 1 : 2? (options are in the images since thought they were harmful phrases)
Answers: 1
Mathematics, 21.06.2019 16:00
Part one: measurements 1. measure your own height and arm span (from finger-tip to finger-tip) in inches. you will likely need some from a parent, guardian, or sibling to get accurate measurements. record your measurements on the "data record" document. use the "data record" to you complete part two of this project. name relationship to student x height in inches y arm span in inches archie dad 72 72 ginelle mom 65 66 sarah sister 64 65 meleah sister 66 3/4 67 rachel sister 53 1/2 53 emily auntie 66 1/2 66 hannah myself 66 1/2 69 part two: representation of data with plots 1. using graphing software of your choice, create a scatter plot of your data. predict the line of best fit, and sketch it on your graph. part three: the line of best fit include your scatter plot and the answers to the following questions in your word processing document 1. 1. which variable did you plot on the x-axis, and which variable did you plot on the y-axis? explain why you assigned the variables in that way. 2. write the equation of the line of best fit using the slope-intercept formula $y = mx + b$. show all your work, including the points used to determine the slope and how the equation was determined. 3. what does the slope of the line represent within the context of your graph? what does the y-intercept represent? 5. use the line of best fit to you to describe the data correlation.
Answers: 2
Mathematics, 21.06.2019 18:00
How many triangles can be drawn with side lengths 4 centimeters, 4.5 centimeters, and 9 centimeters? explain
Answers: 1
Mathematics, 21.06.2019 19:10
At a kentucky friend chicken, a survey showed 2/3 of all people preferred skinless chicken over the regular chicken. if 2,400 people responded to the survey, how many people preferred regular chicken?
Answers: 1
You know the right answer?
Questions

Health, 02.09.2021 20:40


Mathematics, 02.09.2021 20:40

Spanish, 02.09.2021 20:40
Mathematics, 02.09.2021 20:40


Mathematics, 02.09.2021 20:40

Mathematics, 02.09.2021 20:40
Mathematics, 02.09.2021 20:40
Mathematics, 02.09.2021 20:40
English, 02.09.2021 20:40

Chemistry, 02.09.2021 20:40


