
Mathematics, 17.12.2020 20:00 boss713
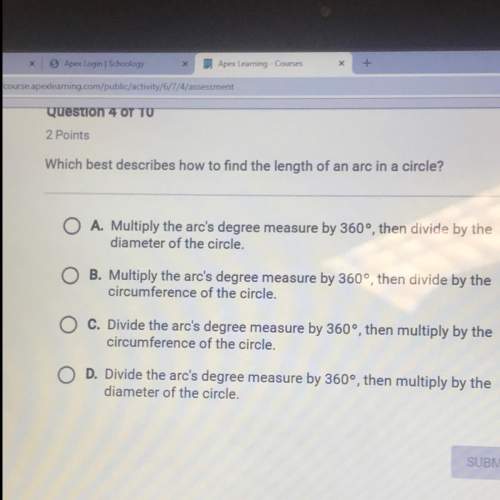
Which graph represents the solution set for the system s + l < 30 and 8s + 12l ≤ 160?
On a coordinate plane, 2 straight lines are shown. The first dashed line has a positive slope and goes through (negative 30, 0) and (0, 30). Everything to the left of the line is shaded. The second solid line has a negative slope and goes through (negative 25, 30) and (negative 10, 20). Everything to the left of the line is shaded.
On a coordinate plane, 2 straight lines are shown. The first solid line has a negative slope and goes through (5, 10) and (20, 0). Everything below and to the left of the line is shaded. The second dashed line has a negative slope and goes through (0, 30) and (30, 0). Everything above and to the right of the line is shaded.
On a coordinate plane, 2 straight lines are shown. The first solid line has a negative slope and goes through (5, 10) and (20, 0). Everything above and to the right of the line is shaded. The second dashed line has a negative slope and goes through (0, 30) and (30, 0). Everything below and to the left of the line is shaded.
On a coordinate plane, 2 straight lines are shown. The first solid line has a negative slope and goes through (5, 10) and (20, 0). Everything below and to the left of the line is shaded. The second dashed line has a negative slope and goes through (0, 30) and (30, 0). Everything below and to the left of the line is shaded.

Answers: 1


Another question on Mathematics
Mathematics, 21.06.2019 17:20
Which of these equations, when solved, gives a different value of x than the other three? a9.1 = -0.2x + 10 b10 = 9.1 + 0.2x c10 – 0.2x = 9.1 d9.1 – 10 = 0.2x
Answers: 1
Mathematics, 22.06.2019 03:00
The biologist has a second culture to examine. she knows that the population of the culture doubles every 15 minutes. after 1 hour and 15 minutes, her assistant found that 80,000 bacteria were present. a) what was the size of the initial population? b) predict the size of the culture at t=3 hours. what was the size of the population at 40 minutes? explain and justify your answers. c) create a graph of the population as a function of time. find an equation that can be used to predict the size of the population at any time t. d) examine the rate at which the bacteria culture is growing. how fast is the culture growing after 1 hour? after 1.5 hours? after 2 hours? use a time interval of h = 0.01 hours to estimate these rates. interpret these rates in terms of the context of the problem situation. how do these three rates compare?
Answers: 1
You know the right answer?
Which graph represents the solution set for the system s + l < 30 and 8s + 12l ≤ 160?
On a coord...
Questions
Mathematics, 25.11.2021 14:10

Chemistry, 25.11.2021 14:10


Mathematics, 25.11.2021 14:10
Physics, 25.11.2021 14:10


