
Mathematics, 16.12.2020 23:30 kellysurgit
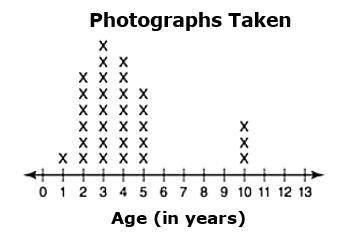
The line plot shows the ages of the children who had their photographs taken at a photography studio during a certain week.
Which statement is true about the graph of the children who had their photographs taken?
A. The graph has an outlier at 1.
B. The data in the graph is symmetrical in shape.
C. The graph has a peak at 10.
D. The graph has a cluster of data.

Answers: 3


Another question on Mathematics
Mathematics, 21.06.2019 21:30
On #16 : explain how factoring a trinomial, ax^2+ bx+ c, when a does not equal 1 different from factoring a trinomial when a = 1.
Answers: 2
Mathematics, 21.06.2019 23:30
The area (a) of a circle with a radius of r is given by the formula and its diameter (d) is given by d=2r. arrange the equations in the correct sequence to rewrite the formula for diameter in terms of the area of the circle.
Answers: 1
Mathematics, 21.06.2019 23:30
Walking at a constant rate of 8 kilometers per hour, juan can cross a bridge in 6 minutes. what is the length of the bridge in meters?
Answers: 1
Mathematics, 22.06.2019 00:00
Which of the following will form the composite function?
Answers: 3
You know the right answer?
The line plot shows the ages of the children who had their photographs taken at a photography studio...
Questions

Business, 01.12.2019 15:31

Geography, 01.12.2019 15:31


Chemistry, 01.12.2019 15:31


Biology, 01.12.2019 15:31

History, 01.12.2019 15:31
Mathematics, 01.12.2019 15:31

Health, 01.12.2019 15:31
Biology, 01.12.2019 15:31
Mathematics, 01.12.2019 15:31

Geography, 01.12.2019 15:31


