
Mathematics, 16.12.2020 06:50 srosrguezbracho
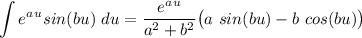
Prove the following integration formula:


Answers: 3
![\frac{d}{dx} [e^u]=u'e^u](/tpl/images/0989/4920/5888c.png) Integration Constant CIntegral 1:
Integration Constant CIntegral 1:  Integral 2:
  Integral 3:
  Integral Rule 1:
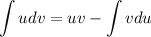
 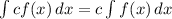 Integration by Parts:
 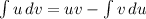 [IBP] LIPET: Logs, Inverses, Polynomials, Exponents, Trig
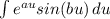
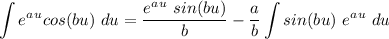
 Integrate [Int Rule 1]:
 Integrate [Int Rule 1]:
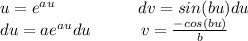
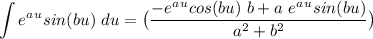
![\int {e^{au}sin(bu)} \, du = \frac{-e^{au}cos(bu)}{b} + \frac{a}{b} [\frac{e^{au}sin(bu)}{b} - \frac{a}{b} \int ({e^{au} sin(bu)}) \, du]](/tpl/images/0989/4920/55ccf.png) [Integral - Alg] Distribute Brackets:
[Integral - Alg] Distribute Brackets:  [Integral - Alg] Isolate Original Terms:
  [Integral - Alg] Rewrite:
  [Integral - Alg] Isolate Original:
 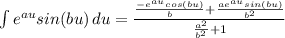 [Integral - Alg] Rewrite Fraction:
 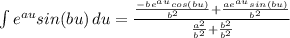 [Integral - Alg] Combine Like Terms:
 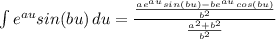 [Integral - Alg] Divide:
  [Integral - Alg] Multiply:
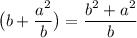
 ![\int {e^{au}sin(bu)} \, du = \frac{1}{a^2+b^2} [ae^{au}sin(bu) - be^{au}cos(bu)]](/tpl/images/0989/4920/0139a.png) [Integral - Alg] Factor:
[Integral - Alg] Factor: ![\int {e^{au}sin(bu)} \, du = \frac{e^{au}}{a^2+b^2} [asin(bu) - bcos(bu)]](/tpl/images/0989/4920/55c53.png) [Integral] Integration Constant:
[Integral] Integration Constant: ![\int {e^{au}sin(bu)} \, du = \frac{e^{au}}{a^2+b^2} [asin(bu) - bcos(bu)] + C](/tpl/images/0989/4920/6dcbd.png)


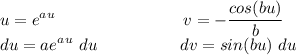


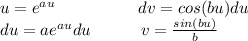
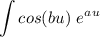 . Find u, du, v, and dv for this function.
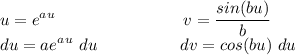


![\displaystyle \int e^a^u sin(bu) \ du = -\frac{e^a^u cos(bu)}{b} + \frac{a}{b} \big{[ }\frac{e^a^u sin(bu)}{b} - \frac{a}{b} \int sin(bu) \ e^a^u \ du \big{]}}](/tpl/images/0989/4920/889b2.png)

![\displaystyle \int e^a^u sin(bu) \ du = \frac{1}{b}\big{[} -e^a^u cos(bu)+ a \big{(}\frac{e^a^u sin(bu)}{b} \big{)} - \frac{a^2}{b} \int sin(bu) \ e^a^u \ du \big{]}](/tpl/images/0989/4920/15980.png)


 , so we can multiply both sides of the equation by
  .
. 

 from the numerator.
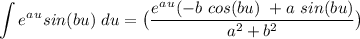


Another question on Mathematics
Mathematics, 21.06.2019 17:10
The frequency table shows a set of data collected by a doctor for adult patients who were diagnosed with a strain of influenza. patients with influenza age range number of sick patients 25 to 29 30 to 34 35 to 39 40 to 45 which dot plot could represent the same data as the frequency table? patients with flu
Answers: 2
Mathematics, 21.06.2019 19:00
Moira has a canvas that is 8 inches by 10 inches. she wants to paint a line diagonally from the top left corner to the bottom right corner. approximately how long will the diagonal line be?
Answers: 1
Mathematics, 21.06.2019 23:00
Which equation shows y= 3 4 x− 5 2 in standard form? a 4x−3y=10 b 3x−4y=10 c 3x−4y=−10 d 4x−3y=−10
Answers: 1
You know the right answer?
Prove the following integration formula:...
Questions


Biology, 20.04.2020 20:27
Mathematics, 20.04.2020 20:27

Health, 20.04.2020 20:27

History, 20.04.2020 20:27
Biology, 20.04.2020 20:27
Biology, 20.04.2020 20:27

History, 20.04.2020 20:27
Mathematics, 20.04.2020 20:27
Mathematics, 20.04.2020 20:27
Mathematics, 20.04.2020 20:27


