2. A linear model for the data in the table is shown in the scatter plot.
x y
1 2
<...

Mathematics, 16.12.2020 05:40 apowers6361
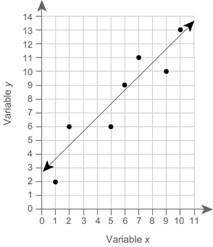
2. A linear model for the data in the table is shown in the scatter plot.
x y
1 2
2 6
5 6
6 9
7 11
9 10
10 13
(a) Which two points should you use to find the equation of the model? Circle the points on the graph.
(b) What is the slope of the linear model? Show your work.
(c) What is the equation of the linear model in point-slope form?
(d) What is the slope-intercept form of the equation you wrote in Part (c)? Show your work.
(e) What is the equation for the least square’s regression line? Round the values for a and b to three decimal places. (Hint: Use a calculator or spreadsheet program.)

Answers: 2


Another question on Mathematics
Mathematics, 21.06.2019 17:30
Enter the missing numbers in the boxes to complete the table of equivalent ratios.time (min) distance (km)? 36 9? 1512 ?
Answers: 3
Mathematics, 21.06.2019 17:40
The graph of h(x)= |x-10| +6 is shown. on which interval is this graph increasing
Answers: 2
Mathematics, 21.06.2019 19:20
1- what do you think the product of a nonzero rational number and an irrational number is? is it rational or irrational? make use of variables, the closure property of integers, and possibly a proof by contradiction to prove your hypothesis.2- why do we have to specify that the rational number must be nonzero when we determine what the product of a nonzero rational number and an irrational number is? if the rational number were 0, would it give us the same result we found in the first question?
Answers: 2
You know the right answer?
Questions


Computers and Technology, 10.11.2019 03:31


