
Mathematics, 16.12.2020 03:20 queenflawless31
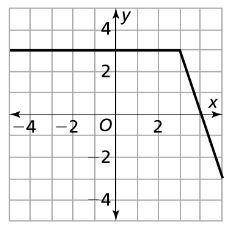
Describe what is happening in the graph below.
A. The function is steady, and then it increases.
B. The function decreases sharply, and then it stays the same.
C. The function increases a little, and then it decreases sharply.
D. The function stays constant, and then it decreases sharply.

Answers: 1


Another question on Mathematics
Mathematics, 21.06.2019 18:30
True or false? a circle could be circumscribed about the quadrilateral below.
Answers: 3
Mathematics, 21.06.2019 18:30
The height of a flare fired from the deck of a ship in distress can be modeled by h(t)= -2(8t^2-52t-28), where h is the height of the flare above water and t is the time in seconds. a. find the time it takes the flare to hit the water.
Answers: 1
Mathematics, 21.06.2019 19:00
[15 points, algebra 2]simplify the complex fraction and find the restrictions.
Answers: 1
Mathematics, 21.06.2019 21:00
The description below represents function a and the table represents function b: function a the function is 5 more than 3 times x. function b x y −1 2 0 5 1 8 which statement is correct about the slope and y-intercept of the two functions? (1 point) their slopes are equal but y-intercepts are not equal. their slopes are not equal but y-intercepts are equal. both slopes and y intercepts are equal. neither slopes nor y-intercepts are equal.
Answers: 3
You know the right answer?
Describe what is happening in the graph below.
A. The function is steady, and then it increases.
Questions


History, 22.01.2021 18:40
Mathematics, 22.01.2021 18:40
History, 22.01.2021 18:40
Mathematics, 22.01.2021 18:40
Mathematics, 22.01.2021 18:40
Mathematics, 22.01.2021 18:40

Chemistry, 22.01.2021 18:40

Biology, 22.01.2021 18:40
English, 22.01.2021 18:40
Biology, 22.01.2021 18:40

Computers and Technology, 22.01.2021 18:40


