Question 17
10 pts 5 1 0 Details
A group of students measure the length and width of a random...

Mathematics, 15.12.2020 21:40 dajahp
Question 17
10 pts 5 1 0 Details
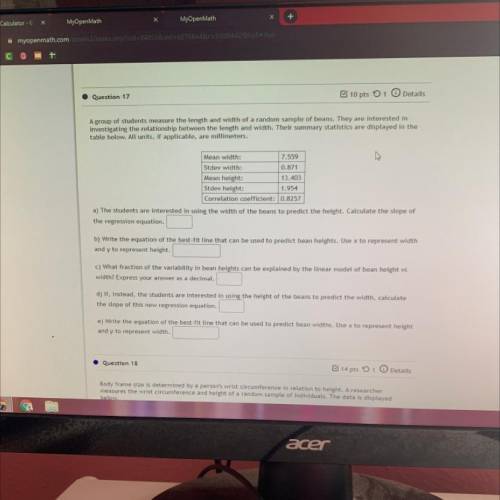
A group of students measure the length and width of a random sample of beans. They are interested in
investigating the relationship between the length and width. Their summary statistics are displayed in the
table below. All units, if applicable, are millimeters.
Mean width:
7.559
Stdev width:
0.871
Mean height:
13.403
Stdev height:
1.954
Correlation coefficient: 0.8257
a) The students are interested in using the width of the beans to predict the height. Calculate the slope of
the regression equation.
b) Write the equation of the best fit line that can be used to predict bean heights. Use x to represent width
and y to represent height.
c) What fraction of the variability in bean heights can be explained by the linear model of bean height vs
width? Express your answer as a decimal.
d) If, instead, the students are interested in using the height of the beans to predict the width, calculate
the slope of this new regression equation.
e) Write the equation of the best-fit line that can be used to predict bean widths. Use x to represent height
and y to represent width.

Answers: 1


Another question on Mathematics
Mathematics, 21.06.2019 21:00
The function below show how much jayna and hannah charge for babysitting. which statement best compares the two plants?
Answers: 1
Mathematics, 21.06.2019 22:00
cassidy wants to cut the yellow fabric into strips that are 0.3 yards wide. how many strips of yellow fabric can cassidy make? yellow fabric 16 yards for $108.00.
Answers: 1
Mathematics, 22.06.2019 02:30
The slope of the line whose equation is 3y = 2x - 3 is 2 2/3 3/2
Answers: 1
You know the right answer?
Questions

Computers and Technology, 06.04.2021 16:50

Social Studies, 06.04.2021 16:50

Mathematics, 06.04.2021 16:50


English, 06.04.2021 16:50

Mathematics, 06.04.2021 16:50
English, 06.04.2021 16:50
English, 06.04.2021 16:50


