
Mathematics, 15.12.2020 18:30 shahedalahmad2017
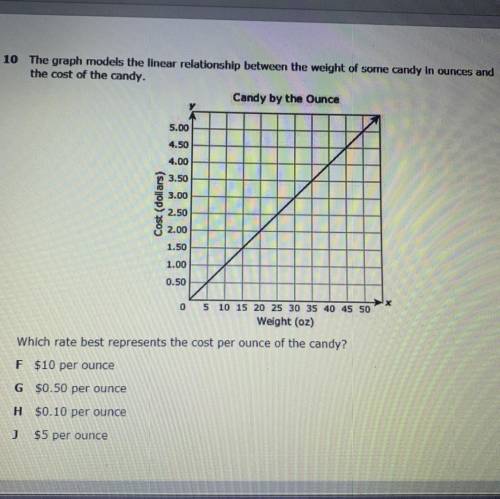
10 The graph models the linear relationship between the weight of some candy in ounces and
the cost of the candy.
Candy by the Ounce
5.00
4.50
4.00
3.50
3.00
Cost (dollars)
2.50
2.00
1.50
1.00
0.50
0 5 10 15 20 25 30 35 40 45 50
Weight (oz)
Which rate best represents the cost per ounce of the candy?
F $10 per ounce
G $0.50 per ounce
H $0.10 per ounce
J $5 per ounce

Answers: 3


Another question on Mathematics
Mathematics, 22.06.2019 00:20
Given sin28.4=.4756, cos28.4=.8796, and tan28.4=.5407 find the cos of 61.6
Answers: 2
Mathematics, 22.06.2019 03:30
Agame has a rectangular board with an area of 44 in2. there is a square hole near the top of the game board in which you must not toss in a bean bag. the square has side lengths of 3 in. what is the probability of not tossing the bag through the hole? a)9/44 b)3/9 c)3/44 d)35/44
Answers: 2
Mathematics, 22.06.2019 03:30
Fracisco's game involves 3 green, 2 yellow, 4 red, and 3 black marbles. if he randomly draws three marbles from the bag, without replacement, what is the probability that he will draw yellow, and then red, and then black? a)1/192 b)1/72 c)3/220 d)1/55
Answers: 1
You know the right answer?
10 The graph models the linear relationship between the weight of some candy in ounces and
the cost...
Questions

Mathematics, 05.05.2020 13:14

Physics, 05.05.2020 13:14

English, 05.05.2020 13:14

History, 05.05.2020 13:14

Chemistry, 05.05.2020 13:14
English, 05.05.2020 13:14
English, 05.05.2020 13:14
Chemistry, 05.05.2020 13:14


