Which inequality is represented by this graph?
+
3 4 5 6 7 8 9
1
2
O x>3...

Mathematics, 15.12.2020 18:00 SupremeNerdx
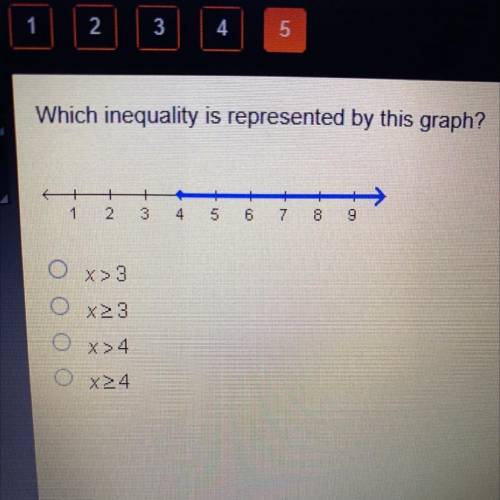
Which inequality is represented by this graph?
+
3 4 5 6 7 8 9
1
2
O x>3
x>3
Ox>4
O x24

Answers: 1


Another question on Mathematics
Mathematics, 21.06.2019 20:20
Complete the input-output table for the linear function y = 3x. complete the input-output table for the linear function y = 3x. a = b = c =
Answers: 2
Mathematics, 21.06.2019 20:30
Tom is the deli manager at a grocery store. he needs to schedule employee to staff the deli department for no more that 260 person-hours per week. tom has one part-time employee who works 20 person-hours per week. each full-time employee works 40 person-hours per week. write and inequality to determine n, the number of full-time employees tom may schedule, so that his employees work on more than 260 person-hours per week. graph the solution set to this inequality.
Answers: 2
Mathematics, 21.06.2019 21:30
Mon wants to make 5 lbs of the sugar syrup. how much water and how much sugar does he need… …to make 5% syrup?
Answers: 2
Mathematics, 21.06.2019 22:00
Aschool allots ? 1500 to spend on a trip to the theatre. theatre tickets have a regular cost of ? 55 each and are on offer for 1 5 off. a train ticket for the day will cost ? 12 each. if 2 teachers and the maximum number of students attend, how much money will the school have left over?
Answers: 2
You know the right answer?
Questions


English, 15.01.2020 08:31
Mathematics, 15.01.2020 08:31

Physics, 15.01.2020 08:31
Mathematics, 15.01.2020 08:31
History, 15.01.2020 08:31
Mathematics, 15.01.2020 08:31
Mathematics, 15.01.2020 08:31

French, 15.01.2020 08:31
Mathematics, 15.01.2020 08:31
English, 15.01.2020 08:31
Mathematics, 15.01.2020 08:31
Mathematics, 15.01.2020 08:31


