Mathematics, 14.12.2020 23:50 zmirandalove100
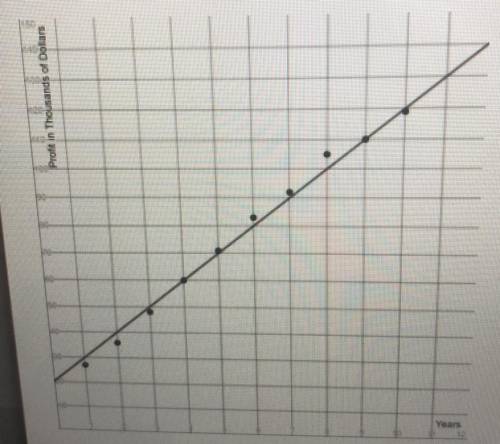
The graph shows the amount of profit in thousands of dollars for a toy each year .A scatter plot of the data is shown below with the line of best fit .
What statement are true related to the line of best fit ? Select all that apply
A. the amount of profit after the first year was around $0.
B. the amount of profit increases about $10,000 each year.
C. the amount of profit decreases about $10,000 each year.
D. the amount of profit after the first year was around $30,000.
E. The amount of profit after 10 years is approximately $120,000.


Answers: 3


Another question on Mathematics

Mathematics, 21.06.2019 14:00
Ben bowled 124 and 188 in his first two games. what must he bowl in his third game to have an average of at least 160?
Answers: 1

Mathematics, 21.06.2019 15:10
The conversion factor relating feet to meters is 1 ft=0.305 m. keep in mind that when using conversion factors, you want to make sure that like units cancel leaving you with the units you need. you have been told that a certain house is 164 m2 in area. how much is this in square feet?
Answers: 1

Mathematics, 21.06.2019 15:30
Will give are given that xy is parallel to zw. if xz is a transversal that intercepts xy and zw, angle angle alternate interior angles. since xy is parallel to zw, we know that these angles are we also know that angle xvy and angle zvw are , and thus congruent. we can conclude that △xyv ~ △zwv using the similarity theorem.
Answers: 2

Mathematics, 21.06.2019 23:00
Type the correct answer in each box. use numerals instead of words. the average number of subscribers to an online magazine each year from 2010 to 2015 is given in the table below. the average number of subscribers to the online magazine in 2010 was the percent increase in the average number of subscribers in 2011 to the average number of subscribers in 2012 was %. the maximum average number of subscribers to the online magazine in the years shown was
Answers: 2
You know the right answer?
The graph shows the amount of profit in thousands of dollars for a toy each year .A scatter plot of...
Questions

Social Studies, 22.02.2021 22:00


English, 22.02.2021 22:00

Chemistry, 22.02.2021 22:00


History, 22.02.2021 22:00


Biology, 22.02.2021 22:00


Mathematics, 22.02.2021 22:00


History, 22.02.2021 22:00

Social Studies, 22.02.2021 22:00


History, 22.02.2021 22:00


Mathematics, 22.02.2021 22:00


