
Mathematics, 14.12.2020 20:50 ctomo2004
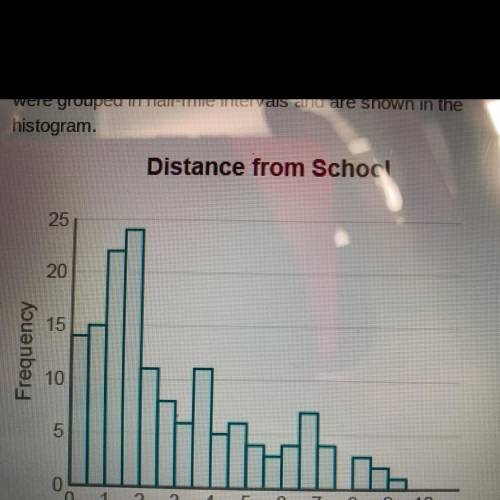
One hundred fifty students in a high school class were
asked how far they lived from the school. Responses
were grouped in half-mile intervals and are shown in the histogram.
The best description of the histogram of distances is
•skewed left and single peaked
•skewed left and double peaked
•skewed right and single peaked
•skewed right and double peaked
•roughly symmetric

Answers: 1


Another question on Mathematics
Mathematics, 21.06.2019 15:40
What is the distance between the points 4,10 and -3,-14 on the coordinate plane
Answers: 2
Mathematics, 21.06.2019 20:00
Write each of the following numerals in base 10. for base twelve, t and e represent the face values ten and eleven, respectively. 114 base 5 89t base 12
Answers: 1
Mathematics, 21.06.2019 22:20
Select the correct answer from each drop-down menu. the table shows the annual sales revenue for different types of automobiles from three automobile manufacturers. sales revenue (millions of dollars) suv sedan truck marginal total b & b motors 22 15 9 46 pluto cars 25 27 10 62 panther motors 26 34 12 72 marginal total 73 76 31 180 the company with the highest percentage of sales revenue from sedans is . of the annual sales revenue from suvs, the relative frequency of pluto cars is .
Answers: 1
You know the right answer?
One hundred fifty students in a high school class were
asked how far they lived from the school. Re...
Questions


Computers and Technology, 30.10.2020 16:50

Computers and Technology, 30.10.2020 16:50
Mathematics, 30.10.2020 16:50


