
Mathematics, 12.12.2020 16:10 davidcortez27
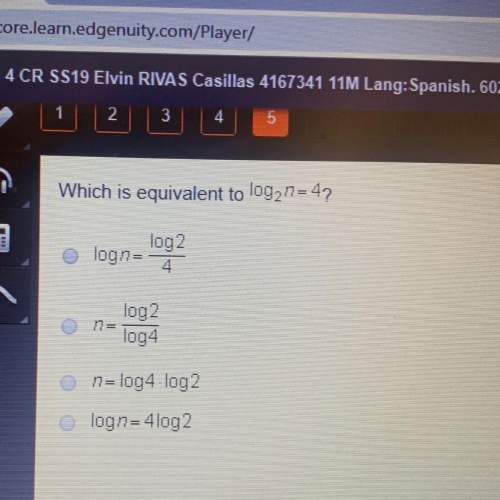
The graph below shows the numbers of cups of strawberry juice that are mixed with different numbers of cups of lemon-lime soda to make servings of strawberry soda:
A graph is shown. The values on the x axis are 0, 1, 2, 3, 4, 5. The values on the y axis are 0, 7, 14, 21, 28, 35. Points are shown on ordered pairs 0, 0 and 1, 7 and 2, 14 and 3, 21 and 4, 28. These points are connected by a line. The label on the x axis is Lemon-Lime Soda in cups. The title on the y axis is Strawberry Juice in cups.
What is the ratio of the number of cups of strawberry juice to the number of cups of lemon-lime soda?
1:28
28:1
7:1
1:7

Answers: 1


Another question on Mathematics
Mathematics, 21.06.2019 19:30
Which describes the difference between the graph of f(x)=x^2 and g(x)=-(x^2-2)
Answers: 1
Mathematics, 21.06.2019 21:20
If two angles of a triangle have equal measures and the third angle measures 90°, what are the angle measures of the triangle? a. 60°, 60°, 60° b. 45°, 90°, 90° c. 30°, 30°, 90° d. 45°, 45°, 90°
Answers: 2
Mathematics, 22.06.2019 02:30
Solve the system of equations. x=-2y+1 and x+2y=9. show work
Answers: 1
You know the right answer?
The graph below shows the numbers of cups of strawberry juice that are mixed with different numbers...
Questions

Health, 17.05.2021 20:40

Mathematics, 17.05.2021 20:40


English, 17.05.2021 20:40
Mathematics, 17.05.2021 20:40
English, 17.05.2021 20:40
English, 17.05.2021 20:40
Mathematics, 17.05.2021 20:40


